
An Interest In:
Web News this Week
- April 1, 2024
- March 31, 2024
- March 30, 2024
- March 29, 2024
- March 28, 2024
- March 27, 2024
- March 26, 2024
Some of Our Sources
- BoingBoing
- Techcrunch
- Simplebits
- Web Designer Wall
- Web Designer Depot
- CSS Globe
- Specky Boy
- Design Modo
- Android Dissected
- Hashedout
Help Webnuz
Referal links:
How to Make a Bar Chart Race With Python in 2 Minutes
How to create a cool bar chart race animation the easiest way.
Prerequisites: having Python installed on your pc or being registered for Google Colaboratory.
Step 0
First create a new directory for the project (if you use Google Colaboratory skip to step 1)
mkdir my_bar_chart_raceThen create a new virtual environment, and activate it
python3 -m venv venvsource venv/bin/activateStep 1
If you havent already, install pandas
pip3 install pandasInstall the library well use to create the bar chart race named, you wont guess it, bar_chart_race
pip3 instll bar_chart_raceStep 2
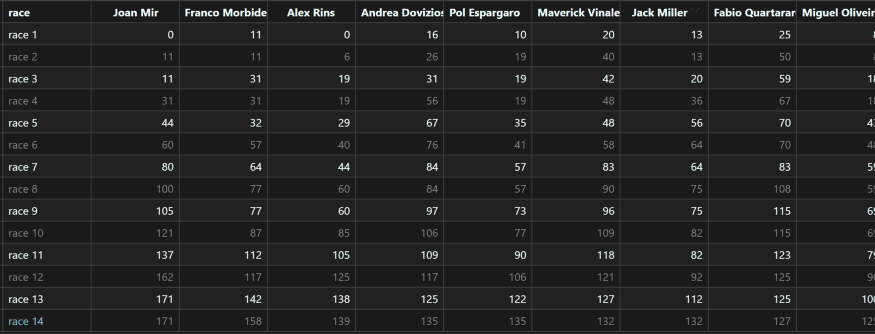
Now that we have the necessary libraries installed, lets load our data.
In this tutorial, well create a bar chart animation of the 2020 MotoGP World Championships title race. If youre not familiar with this sport thats bad dont worry.
I will sum it up briefly for you to better understand what the data means.
How MotoGP works
MotoGP is the premier class of motorcycle road racing. A championship is held every year and consists of many races (or Grand Prix). After each Grand Prix, each rider gains some points depending on his final position at the GP. At the end of the season, the rider with the most point wins the championship.
The point system in use since 1993 is the following:
The dataset
You can find the dataset here.
Step 3
Now the cool part: coding!
Import the libraries
import pandas as pdimport bar_chart_race as bcrLoad the dataset
df = pd.read_csv('./2020-championship.csv')df = df.set_index('race')Let the magic happen
The final result is only one line of code away
bcr.bar_chart_race(df=df, title='2020 MotoGP Championship Race', orientation='h', sort='desc', n_bars=10, steps_per_period=40, period_length=2000)Ok, weve done with the coding. You can save and run the program, and you will obtain as output the bar chart race video.
Done!
Congrats, youve finished. As easy as that.
That was just a short introduction to this library. You can unleash your imagination creating much more advanced races with it.
Original Link: https://dev.to/lorenzofelletti/how-to-make-a-bar-chart-race-with-python-in-2-minutes-4999
Dev To
More About this Source Visit Dev To