
An Interest In:
Web News this Week
- April 25, 2024
- April 24, 2024
- April 23, 2024
- April 22, 2024
- April 21, 2024
- April 20, 2024
- April 19, 2024
Some of Our Sources
- Engadget
- TutsPlus - Code
- Joshua Blankenship
- You The Designer
- FanExtra - PSD
- Noupe
- Crazy Leaf Design
- 24 Ways
- Willems Lab
- Hashedout
Help Webnuz
Referal links:
Deploying Web-Based Data Visualizations with Bokeh in Python
The ability to manipulate data in an easy and readable way has made Python a staple of the data science community. Nevertheless, Python has become an increasingly popular language among web developers who want to build data-centered applications on the web.
One popular Python tool for this purpose is Bokeh, a Python library for building interactive data visualizations for the web.
In this tutorial, were going to show you how to create a Bokeh server with various charts. While well be doing this in Codesphere, a browser-based IDE with easy deployment features, this tutorial is applicable to any IDE.
You can learn more about Codesphere here:
https://codesphere.com/
Getting Started
To start off, in an empty directory create a virtual environment with:
pipenv shell
Once that process is complete, in your virtual environment install Bokeh with:
pipenv install bokeh
Finally, were going to create a main.py file to house the following Bokeh code, which creates a simple line graph:
Alternatively, here is the starter project above ready to deploy from Codesphere (Dont forget to enter your virtual environment and install Bokeh!):
https://codesphere.com/#https://github.com/LiorB-D/BokehServer
Now if you are using a local ide, you can serve this Bokeh application with:
bokeh serve main.py
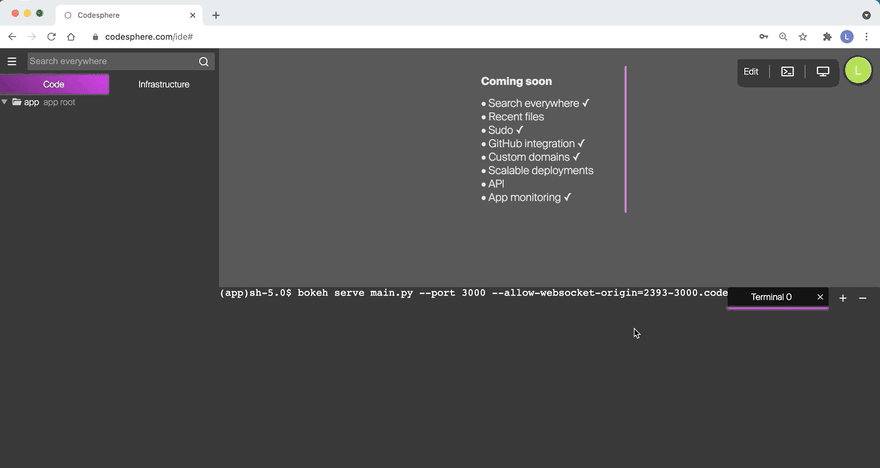
If you are running your app Codesphere, you first need to find the Codesphere URL for your app, which is very easy. Simply press the "deploy app" button and copy the URL you are taken to. It should be in the following format:
APPID-3000.codesphere.com

Once you have that URL, you can deploy your Bokeh app with:
bokeh serve main.py --port 3000 --allow-websocket-origin=<Your URL>
And you then should see your app deployed!
How to Make Different Charts in Bokeh
Even though Bokeh is an incredibly extensive library, it is still very easy to create different types of Charts. Here are the functions to generate different types of basic chart:
Line Chart:
p.line(x,y, line_width=2)

Bar Chart:
p.vbar(x=x, top=y, width=0.5)

Scatterplot:
p.scatter(x, y, size = 20)

Thanks for reading! For more information and updates on how Codesphere is revolutionizing the software industry, follow us on our socials.
Stay tuned and Happy Coding!
Original Link: https://dev.to/codesphere/deploying-web-based-data-visualizations-with-bokeh-in-python-4ai8
Dev To
More About this Source Visit Dev To