
An Interest In:
Web News this Week
- April 1, 2024
- March 31, 2024
- March 30, 2024
- March 29, 2024
- March 28, 2024
- March 27, 2024
- March 26, 2024
Some of Our Sources
- Slashdot
- TutsPlus - Code
- Smashing Apps
- Six Revisions
- Inspiredology
- FanExtra - PSD
- Reencoded
- Wal You
- Freelance Switch
- Codrops
Help Webnuz
Referal links:
Honeycomb, why are my service's requests so slow?!
Honeycomb can be used to help identify the best "bang for your buck" in terms of time spent optimizing for performance.
Suppose I have been asked to spend the next 2 sprints researching and contributing code changes and improvements to help increase service performance. The only information I have been given from customers is:
"Things run slowly right after I login during certain hours of the day."
Needle....haystack...right?
Okay, at least I have some starting points. Honeycomb should still allow me to take this broad symptom of slow requests and investigate further. Trace data includes timestamps and duration fields, which should allow me to get some information about the requests my system sees over time. Our customers seem to notice this most directly after signing in. I know that after signing in, and anytime a user accesses common parts of the platform, their account information is queried. So I think I at least know what microservice to drill into.
Honeycomb can help me drill into even more granular data with a simple query. I construct a query for all of the events my service emits for each API request. I then group them by the endpoint name and the status code result, and create a visualization of the 95th percentile of request duration:

This query tells me that the GET .../profile endpoint responds to 95% of requests in ~910ms or less. Knowing that this is a heavily used endpoint, and compared to the GET .../connectioninfo endpoint that sees similar traffic but at a 100x faster duration, it is apparent that this route is pretty slow compared to other requests to my system. Further querying tells me the average response duration for the /profile endpoint over that same course of time was 473ms. Additionally, P50(duration_ms) (half of all requests) was 363ms.
This endpoint seems like it may be a good candidate for further inspection -- it looks like it is used heavily and that kind of response rate could definitely be a source a slowness for end-users.
Hmm...
How can I learn more?
What specifically about that endpoint is so slow?
Do I need to set up some local performance testing to figure it out?
Of course not!
Honeycomb has all of the info I need in the trace data graphs for the requests I am curious about:
From the query results view, I can drill further into the data by hovering over the name column's value I am interested in (GET .../profile), clicking the ... menu that appears, and selecting the option to show only results where name = GET .../profile and http.status_code = 200.
This is where I can put my detective hat on and start doing the interrogating I talked about in my initial post -- now that I have specific data and a good question to ask ("what is causing the most heavily endpoint of my service, /profile, to be so damn slow?!") I can use Honeycomb to start looking for patterns and the source of the slowness. From my query above, I can see that the pattern is pretty typical during the weekdays -- I narrow my search to 24-48 hours of the work week by highlighting that time range and clicking the "+" button that appears to zoom in my search window.


Oh okay -- at this level I can see that the data is pretty normal aside from a few outliers during off-peak times. I'm mostly curious about peak-usage and typical requests, so I'm going to zoom in even further to the peak usage-time of that endpoint over a 1-2 hour duration.
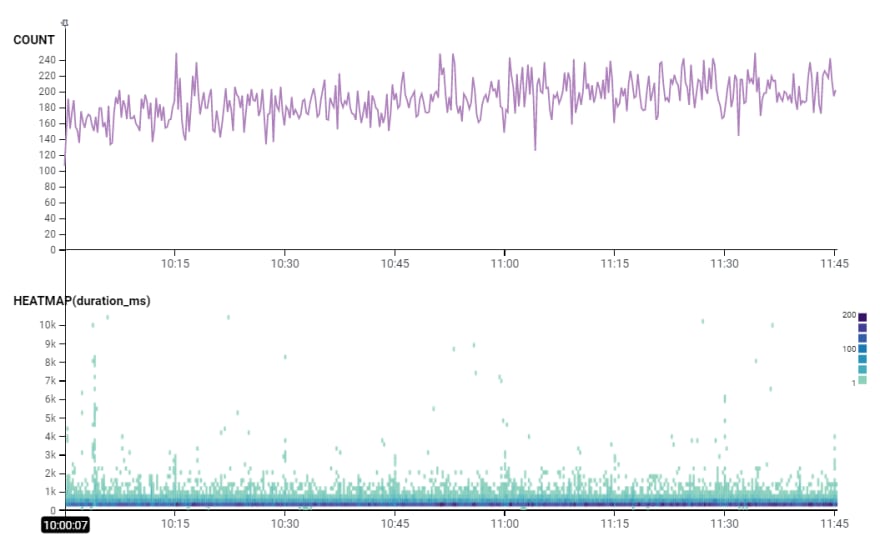
Awesome -- that's much more manageable and more "typical" of the usage scenario I'm concerned with. Once I have drilled in enough and crafted the query for the request data I am interested in examining, I am going to start poking at the trace data for these requests and see if I can't find some common patterns.
I can access trace data for requests a few different ways. The Traces tab in Honeycomb will give me the 10 slowest traces that Honeycomb has for the time range of my query. I can also head on over to the Raw Data tab and click on the trace.trace_id column value for any event I am curious about. Clicking into a trace shows me a time-series waterfall visualization of the request:
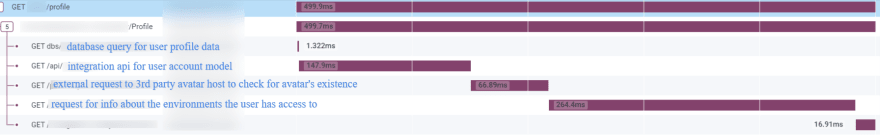
The trace above shows a typical request to the /profile endpoint and helps me understand potential areas for improvement. Keep in mind, I have not even touched the code that runs this service and I have already identified key areas of it that may be in need of attention. If I analyze the trace and walk through the codebase alongside it, I can get context about the external requests the original one generated (these are notated in blue on the screenshot above).
Armed with the request data and its context in code, I can quickly discern what the slow-up is. It turns out, the /profile endpoint is very popular in our platform -- it can be called dozens of times in quick succession as a user navigates to different areas of our applications. This in-and-of-itself is not problematic, however, every time the user's /profile endpoint is called I can see in code and tell from the trace that data changed with a low-frequency (user first/last name, email, avatar image url, user permissions and rights to products on the platform, etc.) is being retrieved from various downstream services and ultimately resulting in multiple database executions.
When the same data is being queried by and for the same user multiple times in quick succession, this results in more resource usage by the server, slower response times, and greater database traffic / spend -- especially in PaaS database models that charge on a request transaction throughput basis.
The highest-trafficked endpoint in our service also happens to be reading the same rarely-changed data from a database for each user, oftentimes in rapid succession (several times in 10 seconds). This is a ripe candidate for a smart in-memory caching mechanism.
Armed with the request duration data, I am now able to tell a full story and pinpoint a worthwhile time to spend investing in performance for my service, all without doing any sort of local performance testing, or even looking at the logic in the code.
Allow the observability data to give you the data and answers you are looking for. It can help identify specific the microservices, endpoints, and areas of the codebase to look at so you are ultimately making the best use of your time and efforts, especially in companies and enterprises with hundreds of microservices supporting a large platform.
In my next post, I'll show how Honeycomb and observability/trace data can be useful tools to help implement smart caching mechanisms to balance service performance and cost. I'll also highlight some other features in Honeycomb, such as Boards and Derived Columns - stay tuned!
Learn more, straight from the Hive:
Original Link: https://dev.to/shayde/honeycomb-in-action-why-are-my-service-s-requests-so-slow-516g
Dev To
More About this Source Visit Dev To