
An Interest In:
Web News this Week
- April 1, 2024
- March 31, 2024
- March 30, 2024
- March 29, 2024
- March 28, 2024
- March 27, 2024
- March 26, 2024
Some of Our Sources
- Engadget
- Team Treehouse
- Pearsonified
- The Logo Smith
- Spoon Graphics
- TutsPlus - Design
- Specky Boy
- Spyre Studios
- The Verge
- TechPowerUp
Help Webnuz
Referal links:
Tools to Visualize your Terraform plan
It all started with this code sample with Terraform scripts
For starters,Terraform is open-source software, developed by HashiCorp, that enables predictable and consistent provisioning of IBM Cloud platform, classic infrastructure, and VPC infrastructure resources by using a high-level scripting language. You can use Terraform to automate your IBM Cloud resource provisioning, rapidly build complex, multi-tier cloud environments, and enable Infrastructure as Code (IaC).
Think of a scenario in which you are revisiting your own Terraform scripts and scratching your head to understand what resources it provisions.
To simplify this, there is an in-built Terraform command
terraform graphThe terraform graph command is used to generate a visual representation of either a configuration or execution plan. The output is in the DOT format, which can be used by GraphViz to generate charts.
You can use the command to generate a .png file from the dot output
terraform graph -type=plan | dot -Tpng > graph.pngor
terraform graph -type=plan | dot -Tpng -o graph.pngIf there are too many resources, then the graph will look something like this.
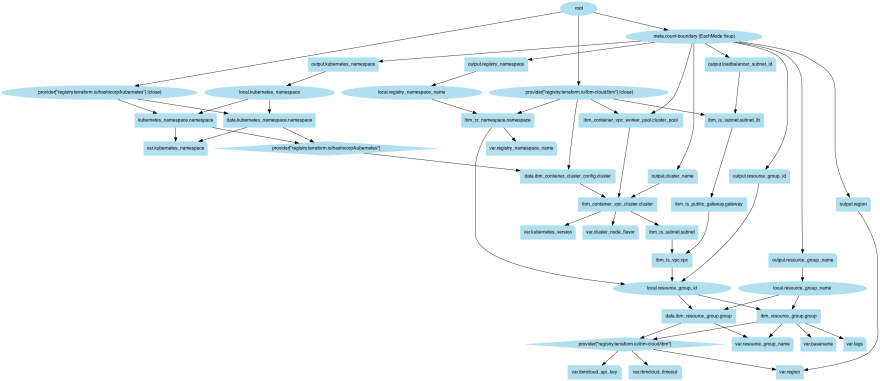
As you can see, readability is a challenge and also there are extra nodes in the graph that are not required. So, you need better tools to visualize your Terraform plan.
Blast radius
Blast Radius is a tool for reasoning about Terraform dependency graphs through interactive visualizations. Awesome tool but couldn't make it work with the newer versions of Terraform. As per the Dockerfile in the respective repository and the comments in the issues, the last Terraform version that worked fine was 0.12.x.
Terraform Visual
Terraform Visual is a simple but powerful tool to help you understand your Terraform plan easily.

Click here to see the large image
Needs additional steps like generating
plan.dotfile and thenplan.jsonfile. but, a pretty good tool for any version of Terraform.
Inframap
Inframap reads your tfstate or HCL to generate a graph specific for each provider, showing only the resources that are most important/relevant.
If you know any other visualization tools, please drop in a comment below and would love to give it a try
Original Link: https://dev.to/vidyasagarmsc/tools-to-visualize-your-terraform-plan-5g3
Dev To
More About this Source Visit Dev To