
Some of Our Sources
- BoingBoing
- The Logo Smith
- Six Revisions
- Vandelay Design
- Creative Curio
- Naldz Graphics
- Fudge Graphics
- 24 Ways
- Spyre Studios
- Hashedout
Help Webnuz
Referal links:
What is the most interesting place in the backyard? Make yourself a heatmap
Data
Obviously if we talk about heatmaps, we talk about displaying some data. Today it is about displaying heatmap on an image. In this case it will be dog position in the garden. You can read how to obtain such position here. Connect the dots, and you will have some cool system in your garden .
First, I have to admit that I don't have a dog. Data will be generated randomly X and Y positions.
import numpy as np# 100 random pairs of x and y in range from 0 to 20data = np.random.randint(0,20,(100,2))Image to put heatmap on it
Now I will use my talent a bit . Hope you can see a garden here.

Load image and put data strait forward on it
Let's use OpenCV and add some dots. Assume that our garden is 20 m long. Scale coordinates to shape of our image.
import numpy as np import cv2 data = np.random.randint(0,20,(100,2))map_img = cv2.imread("HERE PUT PATH TO IMG ON DISC")width, height, _ = map_img.shape for coord in data: x, y = coord x = int(( x / 20 ) * width) y = int(( y / 20 ) * height) cv2.circle( map_img, (x,y), 20, (255,0,0), -1 )while True: cv2.imshow("map", map_img ) if cv2.waitKey(1) & 0xFF == ord("q"): breakcv2.destroyAllWindows()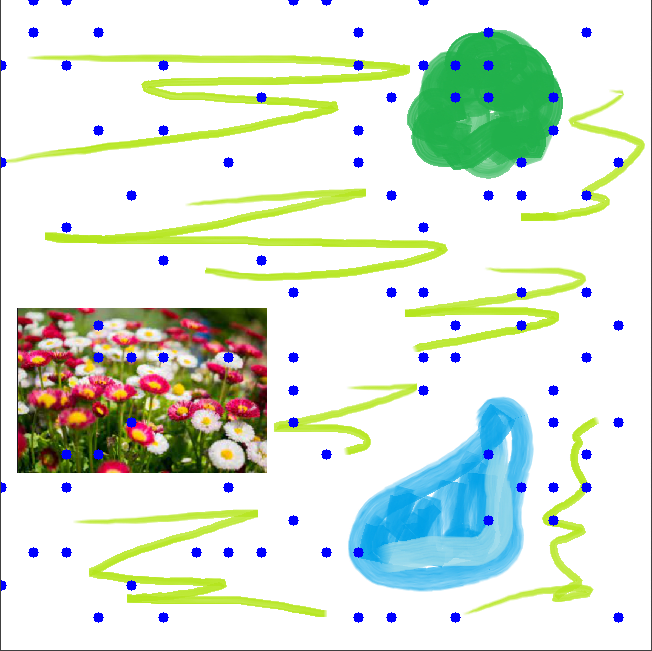
Hmm. There is some data, but it's hard to analyze it. Let's dig deeper.
Let's make second image, blank one. We will put our data on it, manipulate a bit and then overlay on target image.
Blank image is quite easy in OpenCV. Just matrix with zeros.
heatmap_image = np.zeros((height,width,1), np.uint8) Putting data on it is the same as above. Use
. You should be able to display such dots.### Manipulate themUse ``cv2.distanceTransform()`` for all pixels. It changes pixels value based on distance to the nearest pixel with value 0. So if there is a lot of points in one place, value will be higher.```pythonheatmap_image = cv2.distanceTransform(heatmap_image, cv2.DIST_L2, 5)
Quite good! Now let's add some color. To make in more readable, in this example I'm multiplying every pixel by 2.5. Change this value and see what happens.
# here I make those points a bit biggerheatmap_image = heatmap_image * 2.5heatmap_image = np.uint8(heatmap_image)heatmap_image = cv2.applyColorMap(heatmap_image, cv2.COLORMAP_JET)Remember that cv2.distanceTransform( ) change type of data a bit. We have to change it back to np.uint8.
Overlay
Final step. Overlay those two images.
fin_img = cv2.addWeighted(heatmap_image, 0.5, map_img, 0.5, 0)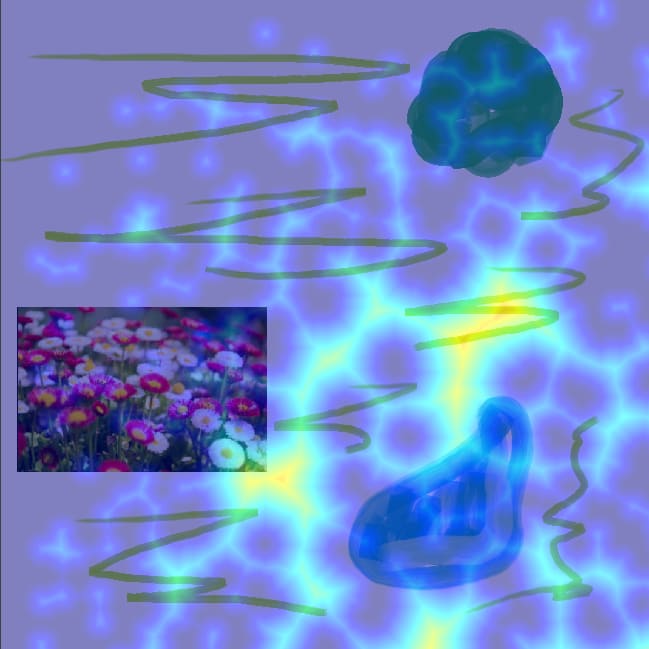
We can see the data now! We can assume where our dog spends most of the time.
Try to connect this with this post, and you can make quite interesting camera system . You can try changing values in distanceTransform( ) too. For example try different distance types. They will change your heatmap a bit.
Original Link: https://dev.to/kuba_szw/what-is-the-most-interesting-place-in-the-backyard-make-yourself-a-heatmap-2k7b
Dev To
More About this Source Visit Dev To