
An Interest In:
Web News this Week
- April 1, 2024
- March 31, 2024
- March 30, 2024
- March 29, 2024
- March 28, 2024
- March 27, 2024
- March 26, 2024
Some of Our Sources
- Engadget
- Technology Review
- TutsPlus - Code
- TutsPlus - Design
- Web Designer Depot
- My Ink Blog
- CSS Tricks
- Design Modo
- Hashedout
- The Verge
Help Webnuz
Referal links:
R pie
How to construct Pie Charts in R programming
Creating a basic pie chart in R is as easy as pie. If list or vector is a list of positive numbers, then simply use the pie() function to draw the pie.
Example1
let's try to use the following data to construct pie chart.
30,40,60,50,30.
To represent the five data listed above in pie chart we type the following codes:
<< Codes>>
Data=c(30,40,60,50,30)pie(Data)<< Result>>

looking at the graph it is exactly the chart of the 5 data but it doesn't make sense enough as sometime it might not be just number we might need to label. so let's take a look at a beautiful example.
Example2
Represent the following table in form of pie chart.
| Students | Scores |
|---|---|
| Maxwizard | 60 |
| Precious | 50 |
| Abass | 70 |
| John | 65 |
| Victoria | 55 |
Solutions
to draw the pie we need to list all the score and the students name accordingly inside two different vector then put inside the pie function.
<< Codes>>
Students=c("Maxwizard","Precious","Abass","John","Victoria")Scores=c(60,50,70,65,55)pie(Scores,label=Students)<< Result>>

study the codes and the result it is not different from example1 except that we make use of label parameter. You should be careful when you need to label, notice that it is the score that we need to draw the graph. so all the students name should be assigned to the label parameter.
However, while dealing with chart we might need to write the headings for our chart. Also we might prefer some colours to others. Therefore there are some other parameters which you can use to perform these actions, they are:
col: this is use to change the color of the part of the chart.main: this is used to write the heading of your chart.
Example3
the following table show the number of students in each class in Government secondary school. draw a pie chart for the table.
| Class | Number of Student |
|---|---|
| JSS1 | 40 |
| JSS2 | 30 |
| JSS3 | 30 |
| SSS1 | 25 |
| SSS2 | 45 |
| SSS3 | 65 |
<< Codes>>
Class<-c("JSS1","JSS2","JSS3","SSS1","SSS2","SSS3")Number<-c(40,30,30,25,45,65)color<-c('red','green','orange','yellow','blue','violet')pie(Number,labels=Class,col=color,main="Government Secondary School")<< Result>>

wooow! we just get a beautiful result! that is cool! but sometimes you might be working with so many data and you might not want to label that way. I mean you may like to represent it in form of key therefore you use something called legend label.
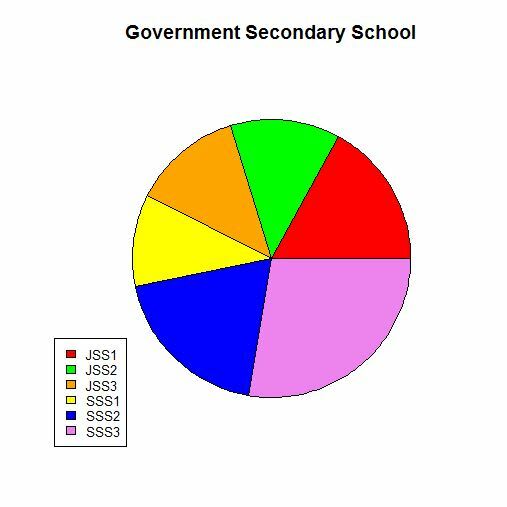
Example4
use the data in Example3 to plot a pie chart.
<< Codes>>
Class<-c("JSS1","JSS2","JSS3","SSS1","SSS2","SSS3")Number<-c(40,30,30,25,45,65)color<-c('red','green','orange','yellow','blue','violet')pie(Number,col=color,main="Government Secondary School",labels="")legendLabel=Classlegend("bottomleft",legendLabel,fill=color,cex=0.8)<< Result>>
Study the codes and the result, we make use of a function called legend() to construct the legend label, the funtion takes four parameters.
- the position of the legend box: this is parameter used to specify where the legend box should be place. it can be bottomleft,bottomright,topleft or topright. you can change the value written in your code to any of the other three to see how it works.
- legendLabel: the is the key of the legend it usually contain the list of data(label) in the chart.
- fill: this is the color, it should be the same color use to construct the chart.
- cex: this is use to specify how big the legend box should be you can change the value to 1 then 2 to see the effect.
Now I beleve you can now construct beautiful pie chart using R. coding is easy and fun just keep struggling and do not stop. like and comment below. you can also chat me up on whats-app (07045225718) have a nice day!.
Original Link: https://dev.to/maxwizard01/r-pie-ikh
Dev To
More About this Source Visit Dev To