
An Interest In:
Web News this Week
- March 21, 2024
- March 20, 2024
- March 19, 2024
- March 18, 2024
- March 17, 2024
- March 16, 2024
- March 15, 2024
Some of Our Sources
- Abduzeedo
- Vandelay Design
- Fuel Your Creativity
- Web Designer Depot
- My Ink Blog
- Fudge Graphics
- Stylized Web
- Codrops
- Willems Lab
- Hashedout
Help Webnuz
Referal links:
Graph Analytics with Python -Graph Generation-
In this article, we explain how to generate various types of graphs such as complex networks, and evaluate the generated graphs using metrics. Before generating the graphs, we load the necessary libraries and define functions to evaluate the density and cluster coefficients.
# Load Moduleimport networkx as nximport matplotlib.pyplot as plt# Define function to quantify Cluster Coefficient def draw_metrics(G, pos): nodes = nx.draw_networkx_nodes(G, pos, node_size=200,node_color="#00C98D") labels = nx.draw_networkx_labels(G, pos) edges = nx.draw_networkx_edges(G, pos) plt.title(["density:{:.5}".format(nx.density(G)), "clustering coefficient:{:.5}".format(nx.average_clustering(G))]) plt.axis("off") plt.show()Watts Strogatz Graph
A Watts-Strogatz graph is a graph generated by connecting all vertices to x neighboring vertices in a lattice with edges, and randomly replacing these edges based on a certain probability.
When the probability is set to 0, the graph is a lattice, when it is set to 1, it is a random graph, and when it is set to around 0.1, it is possible to generate a graph that is both a lattice and a random graph.
In Watts-Strogatz graphs, shortcuts are formed, and the average shortest distance generally satisfies the small-world property.
ws = nx.watts_strogatz_graph(10,5,0.05)pos = nx.spring_layout(ws)draw_metrics(ws, pos)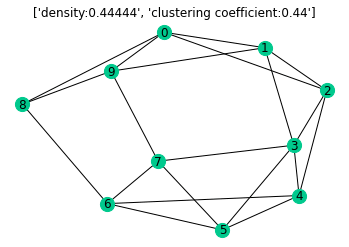
Barabasi Albert Graph
A Barabsi-Albert graph is a scale-free graph in which vertices grow into hubs by adding new edges with high probability to existing vertices with a large degree. The algorithm for generating a Barabsi-Albert graph begins with a complete graph Km consisting of m vertices. A new vertex is added to the complete graph, and an edge is added from that vertex to each of them vertices that already exist.
ba = nx.barabasi_albert_graph(10,2)pos = nx.spring_layout(ba)draw_metrics(ba, pos)
Conclusion
In this article, we generated Watts-Strogatz and Barabsi-Albert graphs to measure the density and cluster coefficients. Since it is possible to generate various other complex networks, it is easy to understand the characteristics of the graphs by referring to the links below.
Link
Original Link: https://dev.to/karapto/graph-analytics-with-python-graph-generation-10j4
Dev To
More About this Source Visit Dev To