
An Interest In:
Web News this Week
- April 1, 2024
- March 31, 2024
- March 30, 2024
- March 29, 2024
- March 28, 2024
- March 27, 2024
- March 26, 2024
Some of Our Sources
- BoingBoing
- Engadget
- Technology Review
- Simplebits
- Team Treehouse
- Abduzeedo
- Creative Curio
- Web Designer Depot
- Willems Lab
- Hashedout
Help Webnuz
Referal links:
The top four React chart libraries that you need to know for 2021
Representing your data in the form of visual charts is a great way to engage with your users. There are countless ways of representing your data visually and it can be daunting trying to choose the right one, ie bar charts, pie charts, infographics charts, and the list goes on. When you are faced with undertaking a challenging React data visualization project, what are your choices?. This article will address just that.
How do I narrow the choices
There is a sea of ReactJs chart libraries out there, for the benefit of this article I have reduced it to 4 that I consider you should research first, depending on your project requirements. Below is the criteria that will be used to evaluate the libraries :
Github Stars: This will give an indication of how popular the library is on Github
Dev Community: Is the development community large and is it well maintained ie regular bug fixes, new features, etc
Built With: What is the underlying library that it is built on,for Majority of cases, its d3.js
Drawing support: Charts can be outputted as SVG, Canvas, or HTML
Mobile Support: Does the library support React native to enable development for android and IOS
Client Side/ Server side: Most are client side libraries, but does the library have any support for server side.
Animation: What level of animation support does the library have
Responsive: How are charts made responsive, some have wrappers, some are out the box ready
Customization flexibility: What level of customization is available, especially for designers.
Examples with live code: Is there good examples of code and documentation
1.Recharts
Recharts is an easy to use component based chart library that works nicely with react. The good thing about recharts is that it provides very nice looking charts out the box. The bad point is that its difficult to customise if you don't like the chart designs it provides. This is one of the first goto chart libraries that most developers turn to first, and is been popular for many years, so has large community and is is well maintained.
Github Stars: 15.5k
Dev Community: large community size and a very good number of developers contributing to the continual development
Built With: React and D3.js
Drawing support: SVG Only
Mobile Support: No version specifically for React native
Client Side/ Server side: Client side
Animation: Very basic animation, NO custom animation support
Responsive: Not by default, need to add wrapper component
Customisation flexibility: There are quite a few little things that are difficult to customize like rendering order and animation.
Example with live code: Good documentation and live code examples at https://recharts.org/en-US/examples
Recharts Demo with code: Area chart with cool gradients and animated tooltips https://codesandbox.io/s/bar-chart-recharts-cqsbn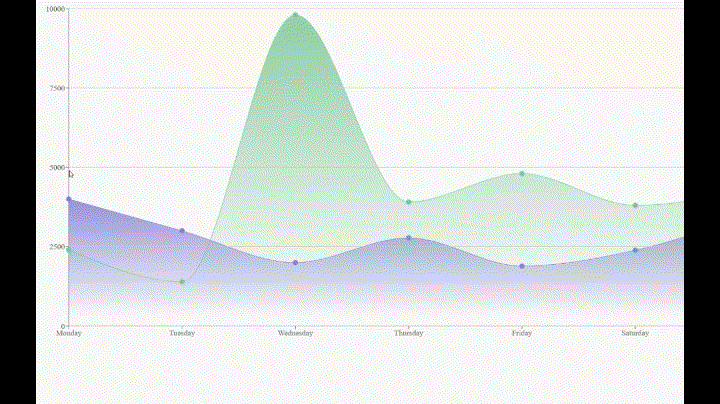
2.Victory
Victory charts provide average looking charts out the box, but it gives you the option to fine tune the designs the way you want it. It also provides some flexibility on the animation front. Its selling point is that it's designer friendly and supports Android and IOS through a React Native version that uses the same API
Github Stars: 7k
Dev Community: Its maintained by team of designers and developers from a respected software development company, Formidable.
Built With: React and D3.js
Drawing support: SVG
Mobile Support: Has a React Native version so can develop for ios and Android
Client Side/ Server side: Client side
Animation : fairly good animation support without external animation Libraries.
Responsive: Provides responsive feature by default for SVG charts
Customisation flexibility: Provides adequate customization through its properties, very designer friendly library. But there is a little bit of a learning curve on using it.
Examples with live code: Good interactive documentation with editable code at https://formidable.com/open-source/victory/docs
Victory Demo with code: Animated pie chart https://codesandbox.io/s/victory-pie-chart-bcmx6

3.VISX (VX)
VISX (VX) uses D3 to perform mathematical computations while you use React to update the DOM. It comprises of small primitive visualization components that can be used to construct complex visualizations like chord, dendrograms, treemap, and Voronoi diagram. It evolved from projects carried out at Airbnb
From Airbnb developer site :
"At Airbnb, we made it a goal to unify our visualization stack across the company, and in the process, we created a new project that brings together the power of D3 with the joy of React."
Advantages are: Keep bundle sizes down, Un-opinionated on purpose, and Not a charting library
Github Stars: 12k stars on Github
Dev Community: Originally developed by Airbnb, Fairly Large community, well maintained
Built With: React and D3.js
Drawing support: SVG
Mobile Support: No support for Mobile
Client Side/ Server side: Client side
Animation: Can support animation with react-spring
Responsive: Not by default, need to add wrapper component
Customisation flexibility: The Use small d3 based primitive visualization components allows you the freedom to build complex visualizations.
Examples with live code: Quite hard to navigate the documentation, Doesn't explain things very well, but do provide examples with code at https://vx-demo.now.sh/gallery
VX Demo with code: Advanced animated Pie chart with inner and outer segments https://vx-demo.now.sh/pies
4.nivo
Nivo s the only Charting library on this list that provides us the ability to generate charts on the server-side as well.
Nivo is capable of generating responsive charts using pure HTML, SVG, and canvas. Canvas charts are faster than SVG for extremely large datasets. HTML charts are ideal for email. So Nivo is a very complete library, unlike the rest in the list. Its also designer friendly.
Github Stars: 8.1k stars on Github
Dev Community: Fairly good community and well maintained
Built With: React and D3.js
Drawing support: SVG,Canvas,HTML
Mobile Support: No support for Mobile
Client Side/ Server side: Both
Animation: Supports animation.
Responsive: Provides responsive feature by default for most charts
Customization flexibility: Fairly good customization, can build a chart using their interactive playground or Storybook.
Examples with live code: Very good interactive documentation and live code on storybook at https://nivo.rocks/storybook/?path=/story/bar--stacked
Nivo Demo with code: Race chart https://codesandbox.io/s/race-chart-lz5s3
Conclusion
Hopefully, this review would help for those seeking a chart library for ReactJs. Choosing the right one is up to you and it all stems from the project requirements. If you want something built on the server side then Nivio is best, If you want to develop for browser and Mobile then Victory is the best, and if you want something quick and clean then Recharts is best. If I had more time I would have included the following libraries too :
React-Vis , React-chartjs-2 and BizCharts. Please leave a comment if you have used these and think they should have been on the list too.
Original Link: https://dev.to/keefdrive/the-top-four-react-chart-libraries-that-you-need-to-know-for-2021-2nl8
Dev To
More About this Source Visit Dev To