
An Interest In:
Web News this Week
- April 4, 2024
- April 3, 2024
- April 2, 2024
- April 1, 2024
- March 31, 2024
- March 30, 2024
- March 29, 2024
Some of Our Sources
- Mashable
- TutsPlus - Code
- Team Treehouse
- Pearsonified
- Vandelay Design
- Naldz Graphics
- CSS Globe
- Line 25
- Wal You
- CSS Tricks
Help Webnuz
Referal links:
Load Testing withLocust
In this post, I will walk through how my team mapped performance characteristics for a web app we created for a customer, and how we picked between using just an App Service, a CDN (Content Delivery Network) and Front Door (all Azure Services). I will use a simple voting app in this blog as an example to compare the results. For our load/performance testing framework we chose to use Locust, an open source load testing tool, as it is scriptable and distributed, and very easy to deploy on Azure. Feel free to follow along for testing your own app!
Goal
Through load/performance testing, our goal was to determine the number of concurrent users and response times that our customer's application could handle. This would help us understand the bottlenecks and capabilities of the page speed, scalability and stability of the web app. We tested the time-to-first-byte speed for the web app as the key performance metric.
Definitions
Before I move into the how and why of our top pick, I'm going to define the 3 solutions so you can better understand what we are comparing here.
- Azure App Service: A fully managed platform for building, deploying and scaling your web apps.
- Content Delivery Network: A content delivery network (CDN) refers to a geographically distributed group of servers which work together to provide fast delivery of Internet content. A CDN allows for the quick transfer of assets needed for loading Internet content including HTML pages, JavaScript files, stylesheets, images, and videos.
- Azure Front Door: Front Door is a global, scalable entry-point that uses the Microsoft global edge network to create fast, secure, and widely scalable web applications.
How to Set up and UseLocust
You can use this deployment script to deploy the locust structure in Azure. If you already know how set up Locust and what the different metrics mean, feel free to skip this section!
Start aTest
Go to the Locust dashboard and follow the instructions. The Locust dashboard can be reached by going to the IP of the master node and port 8089 (Example: http://7xttd3hv5jaac-master.eastus.azurecontainer.io:8089).
Enter the desired numbers and start swarming.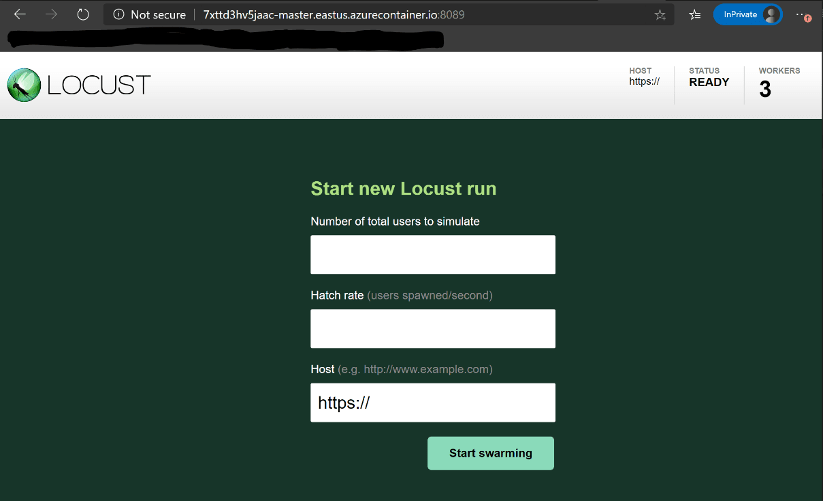
How to pick values:
- Total users to simulate: It's recommended that you start with a number of simulated users that are greater than
number of user classes * number of workerswhen running Locust distributed. In our current case, we have 1 user class and 3 worker nodes. - Hatch rate: If the hatch rate is lower than the number of worker nodes, the hatching would occur in "bursts" where all worker node would hatch a single user and then sleep for multiple seconds, hatch another user, sleep and repeat.
- Host: The host attribute is a URL prefix (e.g., "http://google.com") to the host that is to be loaded.
Note: If number of workers on the dashboard is more that the worker nodes available, redeploy the dashboard with the required number of worker nodes/instances.
View and AnalyzeResults
After swarming for a while, your dashboard will look something like this: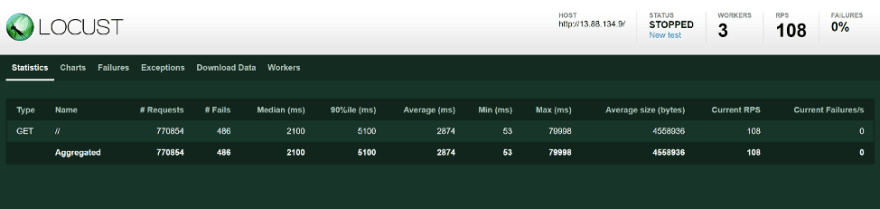
Definitions:
- Requests: Total number of requests made so far
- Fails: Number of requests that have failed
- Median: Response speed for 50 percentile in ms
- 90%ile: Response speed for 90 percentile in ms
- Average: Average response speed in ms
- Min: Minimum response speed in ms
- Max: Maximum response speed in ms
- Average size (bytes): Average response size in bytes
- Current RPS: Current requests per second
- Current Failures/s: Total number of failures per second
Your graphs will look something like this: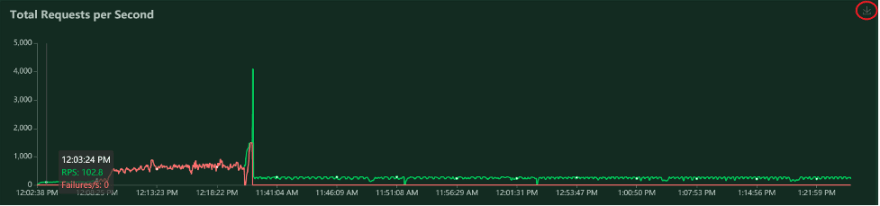
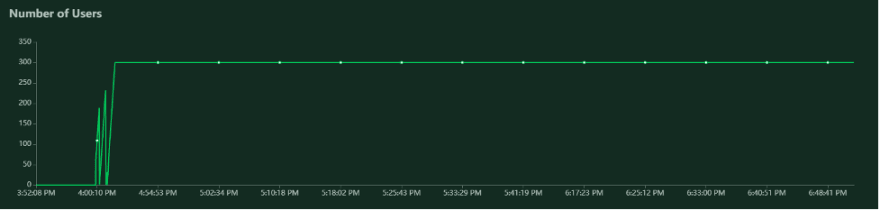
These graphs can be downloaded using the download icon next to them.
And/or you can download the data under the download data tab.
You can analyze the graphs based on response and volume metrics.
Response Metrics
- Average response time measures the average amount of time that passes between a client's initial request and the last byte of a server's response, including the delivery of HTML, images, CSS, JavaScript, and any other resources. It's the most accurate standard measurement of the actual user experience.
- Peak response time measures the roundtrip of a request/response cycle (RTT) but focuses on the longest cycle rather than taking an average. High peak response times help identify problematic anomalies.
- Error rates measure the percentage of problematic requests compared to total requests. It's not uncommon to have some errors with a high load, but obviously, error rates should be minimized to optimize the user experience.
Volume Metrics
- Concurrent users measure how many virtual users are active at a given point in time. While similar to requests per second (see below), the difference is that each concurrent user can generate a high number of requests.
- Requests per second measures the raw number of requests that are being sent to the server each second, including requests for HTML pages, CSS stylesheets, XML documents, JavaScript files, images, and other resources.
- Throughput measures the amount of bandwidth, in kilobytes per second, consumed during the test. Low throughput could suggest the need to compress resources.
Deploy the App Service, CDN and FrontDoor
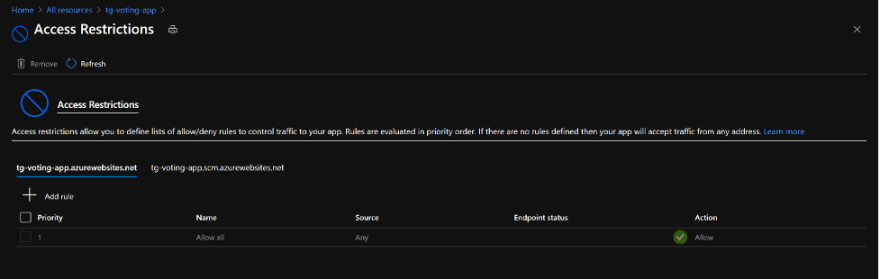
Next, I deployed my app service in conjunction with front door. I used a terraform script written by my colleague to do so. Next, I added a CDN to my app service using this tutorial. For the purpose of this test, I removed all access restrictions for the app service, so that I could avoid the forbidden access (403) issues. I did this by navigating to the networking tab in my app service resource, and then removing all the access restrictions. You can follow along though these screenshots: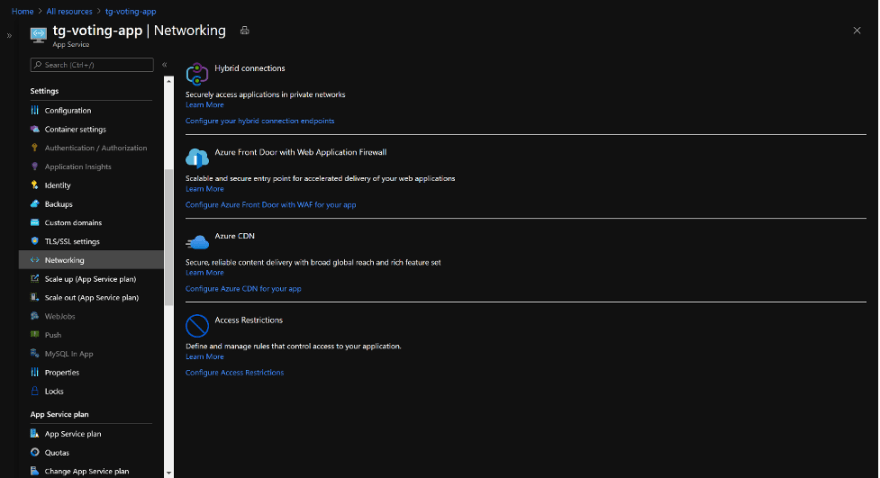
Once this is done, you should have 3 endpoints: an App Service endpoint, a CDN endpoint and a Front Door endpoint.
Running the LocustTests
Assumptions
- The goal of load/performance testing was not to check the correctness of the code or data. Those would require integration or acceptance tests.
- The responsiveness of the different elements of the page were not being tested in the load/performance test.
- The loading time of each components on the map (graphs, content, logos) was not measured since the data points were not being rendered on the initial load.
- The data was embedded as a static geojson in the web app.
Constraints
For our customer, we only tested 2 routes (/ and /about) based on how the web app was set up. For our purposes, to keep things simple, I am only testing 1 route (/). If you would like to test more than 1 route, feel free to edit the python script however you'd like by reading the locust documentation.
Inputs & Controlled Variables
- Number of concurrent users: This value was kept constant at 5000 concurrent users.
- Hatching rate: This value was kept constant at 10 users being spawned every second.
- Time: Each test was run for about 20 minutes.
- Host: This variable was specified based on which infrastructure was being tested. So there were 3 hosts that were tested.
Comparing and Analyzing theResults
Some things to note here:
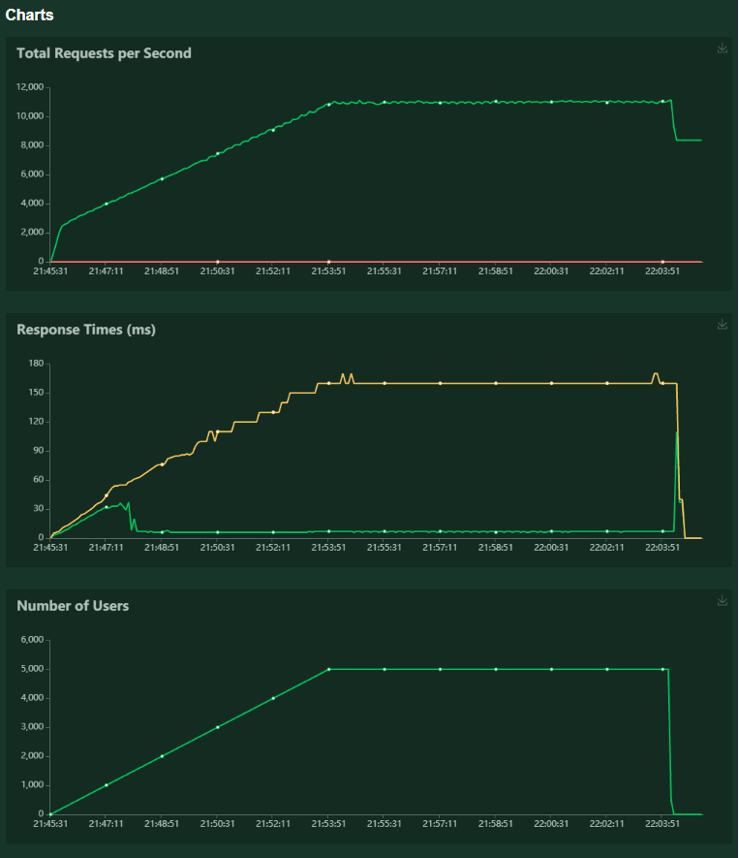
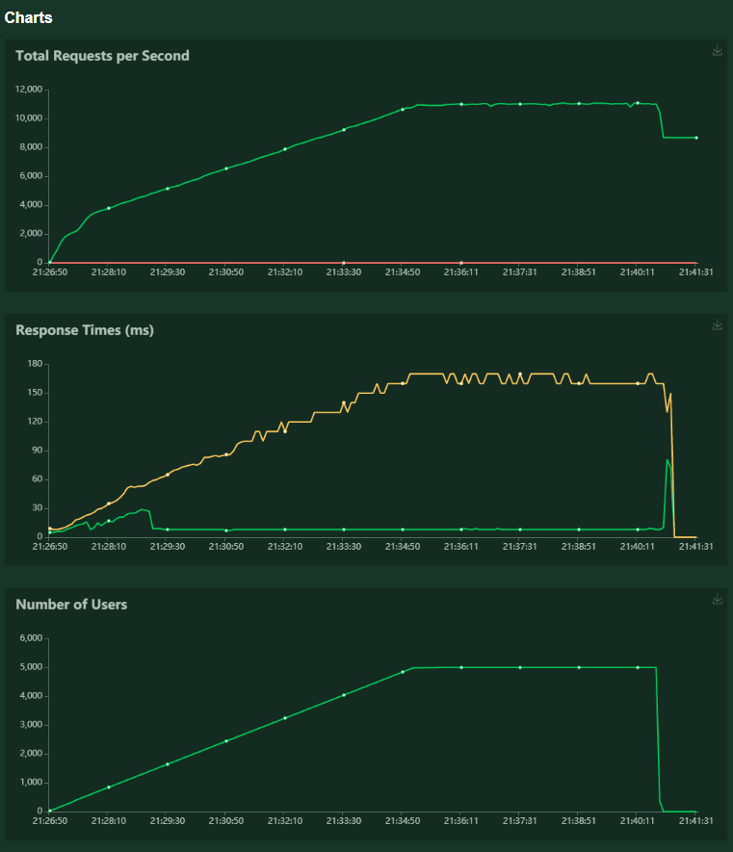
- In the Total Requested chart, the green line shows the successful requests, and the red line shows the failures.
- In the Response Time chart, the green line shows the median response time, and the yellow line shows the 90th percentile.
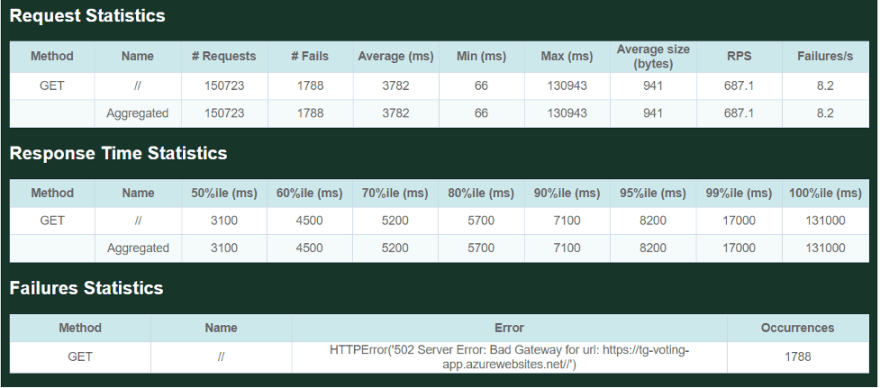
Case 1: Just the AppService

Case 2: App Service with aCDN
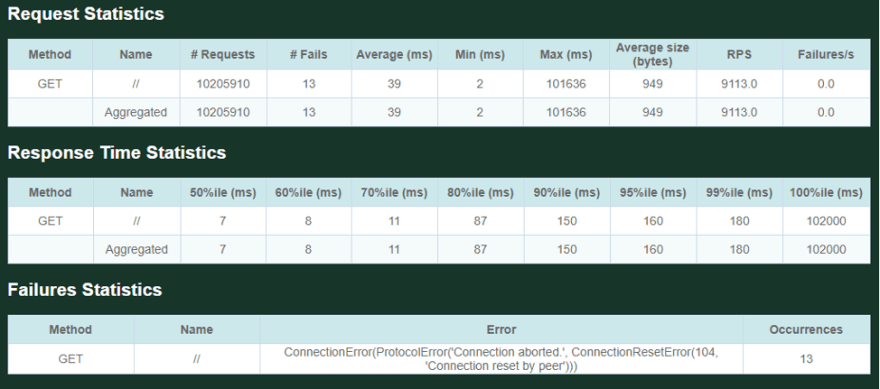
Case 3: App Service with FrontDoor

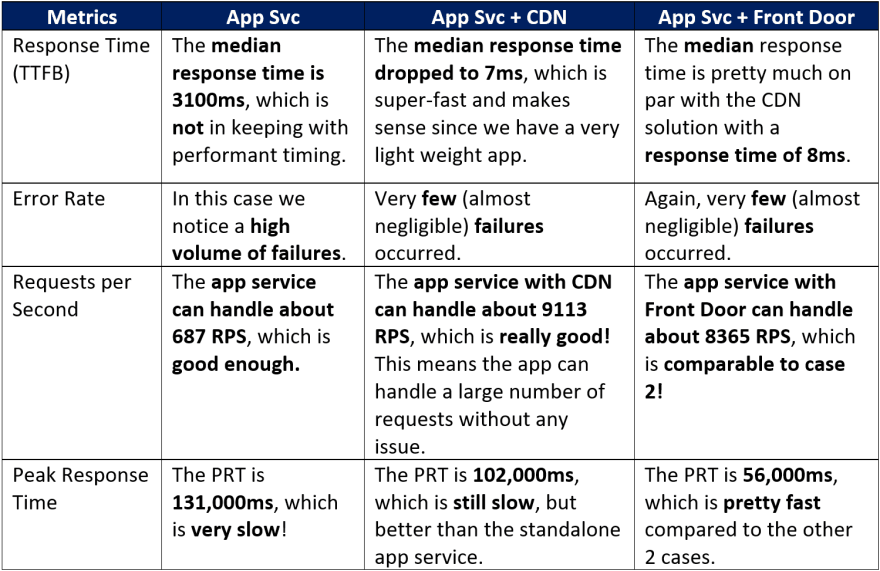
Analysis
If you have been following along with the set up, deployment and running test, the next step is to analyze our data and understand the metrics we use to measure performance. For my particular example, I will be looking at the response time, error rate, requests per second and peak response time. Before we dive into the comparisons, here are some benchmarks and explanations for comparison:
- In 2020, the average Time-To-First-Byte (TTFB) speed was found to be 1.28 seconds (1280ms) on desktop and 2.59 seconds (1590ms) on mobile. However, Google's best practice is to achieve a time under 200ms.
- On average, larger scale applications can reach ~2000 requests per second. Since the application I am testing is lightweight, these numbers might not be very useful. I will still do an analysis so you can do it for yourself.
- Similar to the average response time, the peak response time (PRT) is the measurement of the longest responses for all requests coming through the server. This is a good indicator of performance pain points in the application.
- According to HTTPArchive and their page weight report, the average size of a website is 1.966 Mb for desktop and 1.778 Mb for mobile at the time of writing. Google's best practice is to be below 0.5 Mb.
- The web app we are testing is very lightweight, so it's only 949 bytes. However, our customer's app size was about 4.5 Mb, which was larger to load.
What do the errors mean?
- 104 Connection Reset by Peer: Connection Reset error indicates that a TCP RST was received, and the connection is now closed. This occurs when a packet is sent from the user's end of the connection, but the other end does not recognize the connection; it will send back a packet with the RST bit set in order to forcibly close the connection. This usually happens when there is too much load on the server.
- 502 Bad-Gateway: Bad Gateway server error response code indicates that the server, while acting as a gateway or proxy, received an invalid response from the upstream server.
- 503 Service unavailable: Service Unavailable server error response code indicates that the server is not ready to handle the request. This can also be a result of an uncaught error in your code.
- 504 Gateway-Timeout: Gateway Timeout server error response code indicates that the server, while acting as a gateway or proxy, did not get a response in time from the upstream server that it needed in order to complete the request.
Our FinalChoice
As we can see in the analysis section, the app service performs quite poorly by itself with poor average TTFB, many failures, high peak response time and (for a lightweight application) low requests per seconds. On the other hand, the CDN and Front Door solutions perform pretty much on par given most of the metrics. For our purposes, we picked Front Door because we needed a WAF (Web Application Firewall), which is still in preview for CDN.
I hope reading about how we went about performance/load testing is helpful in setting up your own testing practices! Please feel free to comment or DM me on Twitter (@itstavishi) with any questions, updates or comments you would like me to address!
Original Link: https://dev.to/tavishigupta/load-testing-with-locust-148l
Dev To
More About this Source Visit Dev To