
An Interest In:
Web News this Week
- March 21, 2024
- March 20, 2024
- March 19, 2024
- March 18, 2024
- March 17, 2024
- March 16, 2024
- March 15, 2024
Some of Our Sources
- Engadget
- TutsPlus - Code
- Noupe
- 24 Ways
- Wal You
- Spyre Studios
- Freelance Switch
- Web Resource Source
- Android Headlines
- Hashedout
Help Webnuz
Referal links:
Your first Machine Learning REST API with Python/FastAPI
You will learn...
a basic workflow of creating a machine learning service from stating the problem space to cleaning the data to choosing a model, training your model and finally deploying it to the web.
Requirements
- Basic bash
- Basic use of git/github
- Basic Python3.7
Data Science
You've probably seen this image before: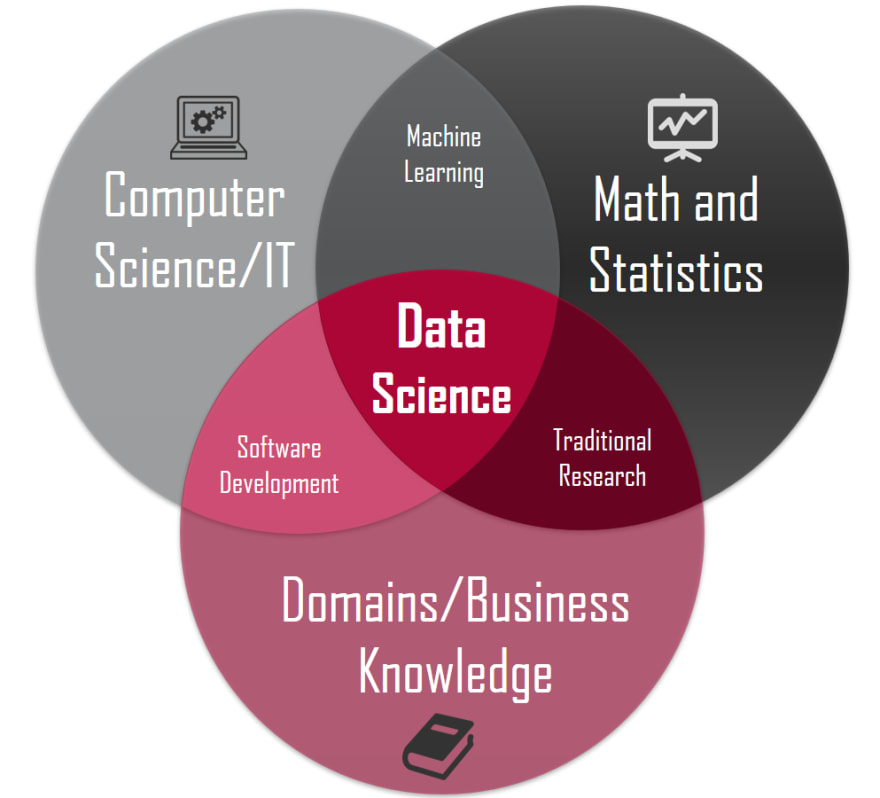
Data science is a hot topic these days and is the cross section of Math, Computers and Business. That sounds nice and all but how do you do data science?
Much like normal science having the scientific method, data science has a couple of methodologies that pave the way of a project. One of the most used methodologies is the CRISP-DM (Cross-industry standard process for data mining)
Said process is described below:
We will be roughly going through each and every single one of these steps today.
Business Understanding
What do want to achieve? Think of key words that can help you find the data for your problem. Maybe you want to solve a global warming problem so you look for data on floods in a certain region. Or maybe you want to speed up the identification of mushrooms at a biology lab so you look for data describing the characteristics of different mushroom species. For now don't think about the data just think about what you want to solve.
For our use case our objective will be: Lowering school dropouts through a tool that can predict students' grade based on a short survey.
Data Understanding
Before we go on we must first understand what kind of data we should look for.
There are three types of data:
Note: Unstructured data can also be images, videos and audio
For classic machine learning (which is the scope of this tutorial) the easiest data type to use is structured data, so that's what we'll be working with.
One of the best places to look for data is Kaggle plus you can start a notebook from the same place so it makes everything a bit easier.
Kaggle is a social network for data scientists where you can find data, competitions, courses and the work of others
Once in Kaggle you can go to the datasets section.

Here you can insert the key words you came up for in the Business Understanding section.
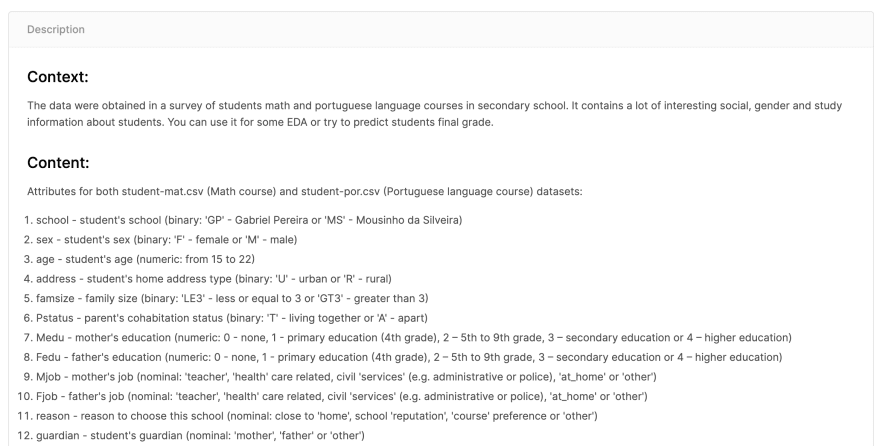
I used the keyword education and found this data set. One of the most important things to consider is the description of the dataset and assure that it well describes the columns. For example:
Now select the **New Notebook* button and select Python and Notebook for the following options, finally click create.
You will be redirected to a Notebook where we can start understanding our data.
Notebooks are a way to run code with cells along with cells that interpret Markdown, this allows us to easily experiment with code while having a great way to document our thought process. These are also known as Kernels.
More on Kernels here
We import libraries used later on, don't worry too much about them for now.

We load our DataFrame (a datatype from the Pandas library that represents a table) and apply some methods to it.
Sample will give us some random rows from our data and the column attribute will just give you a list of the column names.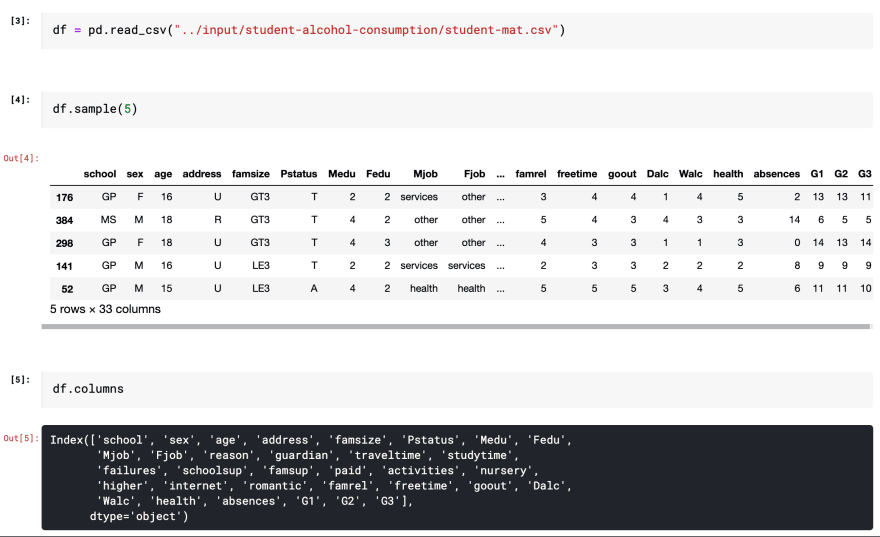
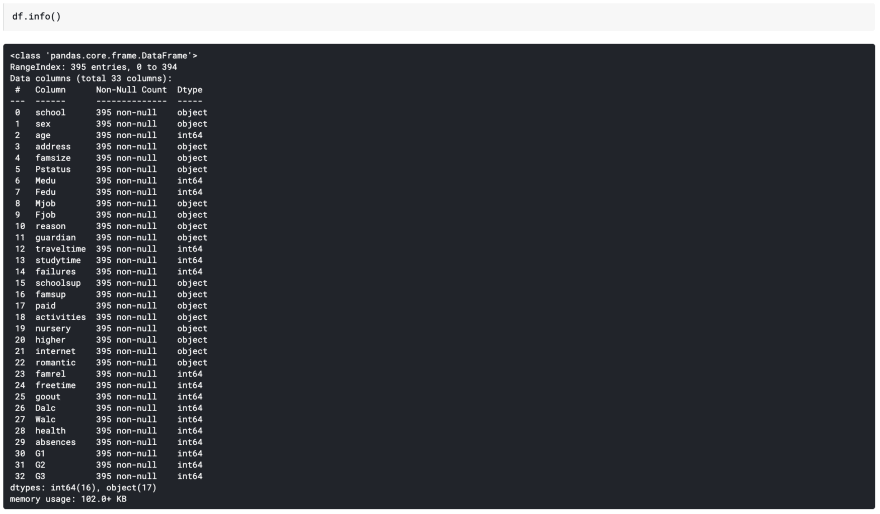
More usefully we can use the info method to find out that we have 16 numerical columns. This is good sign. Given that we are trying to move fast we can avoid having to deal with categorical data.
In an ideal project we would encode our categorical data using labels or one hot encodings. Converting our categorical data into numerical data. This could potentially improve our model.
Below you can see the main data types in tabular data.
The final basic data understanding tool we will use will be the describe method.
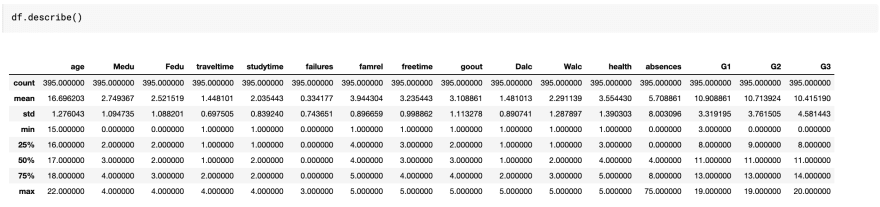
It gives us some descriptive statistics like for example that the final grade (G3) mean is 10.4, which could sound odd given the rang is [0, 20]. So we investigate a little and find that that a 10 in the Portugal grading system is sufficient.

We just came a step closer to understanding our data!
Data Preparation
Here is where we would clean our data, do some normalization, and encoding categorical data. But for the time being we'll just drop all of our categorical data. Which is the most naive strategy.
First we select our target variable which is G3(final grade) which is a numerical column.Our table without G3 are our input columns.
Then using the previously imported train_test_split method we will split our table into two. Our training (70%) dataset and our test (30%) dataset.
This is needed to evaluate how well our model learned from the data

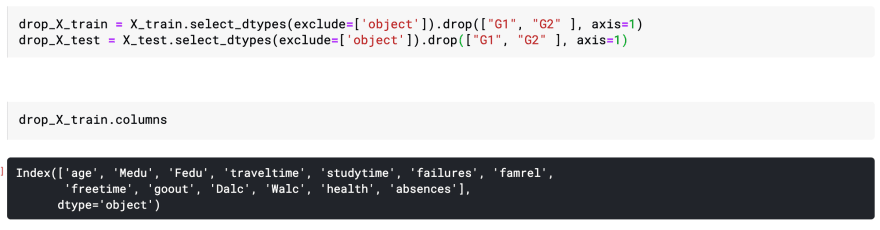
Next we drop all of the categorical data from our training and test data, as well as G1 and G2 (we don't want to involve past grades to predict our future grade)
With the columns attribute we see what columns are left.
Modeling and Evaluation
Time for the fun part!
We now take our training data and fit it to an instantiated RandomForestRegressor with the fit method.
After that we'll predict on our test data, this will result in predicted grades for these test rows.
In order to evaluate our model we'll take our actual test grades and compare them with our predicted grades using the mean average error calculated like so:

All of these steps are put together in the following lines of code.

We see that we have a MAE of 3.15, given the few steps take to process our data this is a good enough result.
Back to Business Understanding
Since we want to make a simple form for our students we'll reduce the input variables needed for the prediction.
Using code copied from some obscure Stackoverflow post we can see an ordered list of the most important features used in the model.
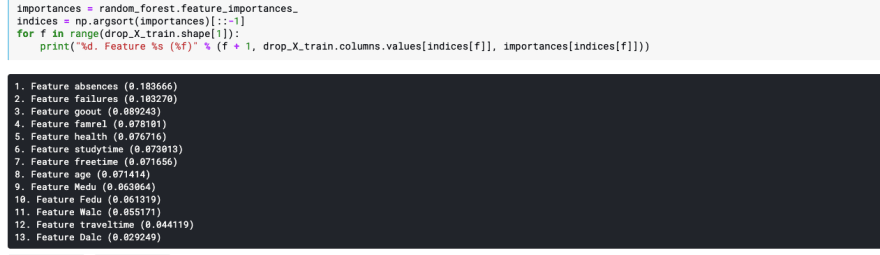
We'll take top ten data points dropping the rest of the columns, then we'll train our model again and see how well it fits our new data.

Apparently this is an even better model than the previous while using less data.
We accept our results and finish this process saving this model as a file with the Pickle model. We'll download this file and save it for later.

Deployment
We now have a working model but this model is useless unless anybody uses it. Deploying a model is its own challenge. In this workshop we'll do a MacGyver-like deploy using FastAPI and Deta.
- Create a free account with Deta
- Create a directory for your new project
mkdir grading_prediction_servicecd grading_prediction_service- Install virtualenv and create a Python virtual environment
python3 -m pip install virtualenvpython3 -m virtualenv .venvsource .venv/bin/activate- Let's create a requirements.txt which hold our dependancies containing the following
scikit-learnpandasnumpyfastapiuvicornjoblib- Install these dependancies in our virtual environment
pip install -r requirements.txt- Create a main.py file and add the following code
from fastapi import FastAPIapp = FastAPI()@app.get("/")async def root(): return {"message": "Hello World"}- Start the test server and in another terminal window use curl to test our endpoint
uvicorn main:app --reloadcurl http://127.0.0.1:8000We now have our hello world endpoint!
Now we'll see how to take this to where we need it to.
- We change our code adding a pydantic data class
from fastapi import FastAPIfrom pydantic import BaseModelapp = FastAPI()class Answer(BaseModel): age: int Medu: int studytime: int failures: int famrel: int freetime: int goout: int Walc: int health: int absences: [email protected]("/")async def root(): return {"message": "Hello World"}Data classes are used to validate data types when receiving data, this is what we will be receiving from the client.
Move your model.mo file to this directory
- Let's create a new post endpoint that will receive our survey data
from fastapi import FastAPIfrom fastapi.encoders import jsonable_encoderfrom pydantic import BaseModelapp = FastAPI()class Answer(BaseModel): age: int Medu: int studytime: int failures: int famrel: int freetime: int goout: int Walc: int health: int absences: [email protected]("/")async def root(): return {"message": "Hello World"}@app.post("/grade_predict")async def predict_student_grade(answer: Answer): answer_dict = jsonable_encoder(answer) for key, value in answer_dict.items(): answer_dict[key] = [value] # answer_dict = {k:[v] for (k,v) in jsonable_encoder(answer).items()} return answer_dictThis will receive the body data, convert it into a dictionary and then convert the values in into lists. The comment is a one liner version of the same thing using a dictionary comprehension.
- Create a file in the same directory names test_prediction.json with these values
{ "age": 19, "Medu": 1, "studytime": 2, "failures": 1, "famrel": 4, "freetime": 2, "goout": 4, "Walc": 2, "health": 3, "absences": 0}- Test your new post endpoint with curl
curl --request POST \ --data @test_prediction.json \ http://127.0.0.1:8000/grade_predict- Finally we'll load our model, convert our dictionary into a Pandas DataFrame, feed our input to the model and return the predicted result.
import pickleimport pandas as pdfrom fastapi import FastAPIfrom fastapi.encoders import jsonable_encoderfrom pydantic import BaseModelapp = FastAPI()with open("model.mo", "rb") as f: model = pickle.load(f)class Answer(BaseModel): age: int Medu: int studytime: int failures: int famrel: int freetime: int goout: int Walc: int health: int absences: [email protected]("/")async def root(): return {"message": "Hello World"}@app.post("/grade_predict")async def predict_student_grade(answer: Answer): answer_dict = jsonable_encoder(answer) for key, value in answer_dict.items(): answer_dict[key] = [value] # answer_dict = {k:[v] for (k,v) in jsonable_encoder(answer).items()} single_instance = pd.DataFrame.from_dict(answer_dict) prediction = model.predict(single_instance) return prediction[0]- Play with your brand spanking new ML API changing the different values in test_prediction.json and using curl
curl --request POST \ --data @test_prediction.json \ http://127.0.0.1:8000/grade_predictThis is great and all but how about we deploy this thing to the internet?
- Install the Deta CLI
curl -fsSL https://get.deta.dev/cli.sh | sh- Login to your account
deta login- Create a new python micro
deta new --python ml_grading_serviceThis will return an endpoint which is where you will be testing your new endpoint
- Deploy your app to your micro
deta deploy- Test your endpoint with the info given the previous endpoint
curl --request POST \ --data @test_prediction.json \ https://XXXXX.deta.dev/grade_predictThat is the whole CRISP-DM process. From start to finish. I hope you learned something new or at least have a new general view of what it to takes to make a data product. There are a ton of areas where this can be improved and I would love to see comments proposing improvements.
You can check out the repo, I also added a very badly written front end using React. The demo can be found here and my Kaggle kernel can be found here

Original Link: https://dev.to/gabogomez09/your-first-machine-learning-rest-api-with-python-fastapi-18jm
Dev To
More About this Source Visit Dev To