
Some of Our Sources
- Mashable
- Technology Review
- TutsPlus - Design
- Fudge Graphics
- CSS Globe
- Freelance Switch
- Web Resource Source
- Android Dissected
- Codrops
- The Verge
Help Webnuz
Referal links:
Making Sense of the JS Framework Benchmark
You've heard about a new library and you've decided you want to look into it. Perhaps you need to make a decision on the technology you haven't had a chance to use yet. You've read some articles, seen some endorsements on social media, but now you need to quickly get to the core of the matter.
You can browse NPM downloads, and stack overflow to get an idea of the ecosystem. You can look at Github to look at how issues are being handled and look at the number of stars to gauge popularity. But what if you want to understand the library or technology itself?
What about a benchmark?
Today I want to look at what I believe to be the best benchmark suite for JS UI Frameworks. That is the JS Framework Benchmark. Almost 100 different libraries are compared with implementations often written or supported by the authors/maintainers themselves. And most importantly the scenario, while hyperbolic, is based on simulating end-user actions when working with a list. These are actions users do every day in apps.
However, this is not the place to start your journey. Benchmarks are just one tool and only tell one side of the story. Luckily there are a few tools out there that will help you get an idea of before digging deeper.
1. TodoMVC (http://todomvc.com/)
This is probably the single most important demo for any JS library to make. It's the simplest example and the template and the view is standardized. They provide stock CSS.
You can browse the code and see what it is all about. If you can't stand the TodoMVC implementation you will probably not like the library.
Best of all basically every JS library has an implementation. A quick search will usually reveal just about any library you can think of.
2. The RealWorld Demo (https://github.com/gothinkster/realworld)
This is a significant step up from the TodoMVC example. We have a real app here. A small app to be sure but these implementations still take implementors weeks to put together. Still, a lot of library maintainers go through the trouble of submitting to this demo. There are dozens of different implementations floating around.
This demo is strictly spec'd out and all the styles and view template structures are set for you. This makes each implementation very comparable.
And it is even a better indicator of if you'd like the code. You can start seeing characteristics of what its like to build apps. You can start to see patterns and a bit of the ecosystem. And you can start seeing things like initial load performance and bundle sizes.
Understanding the Tests
The JS Framework Benchmark consists of a number of tests spanning from performance, to loading time, to memory usage. It is basically a TodoMVC example on steroids testing all the common list operations on a scale of 1000s of rows.
I'm going to grab a few libraries from the current results page to explain how to interpret this benchmark.
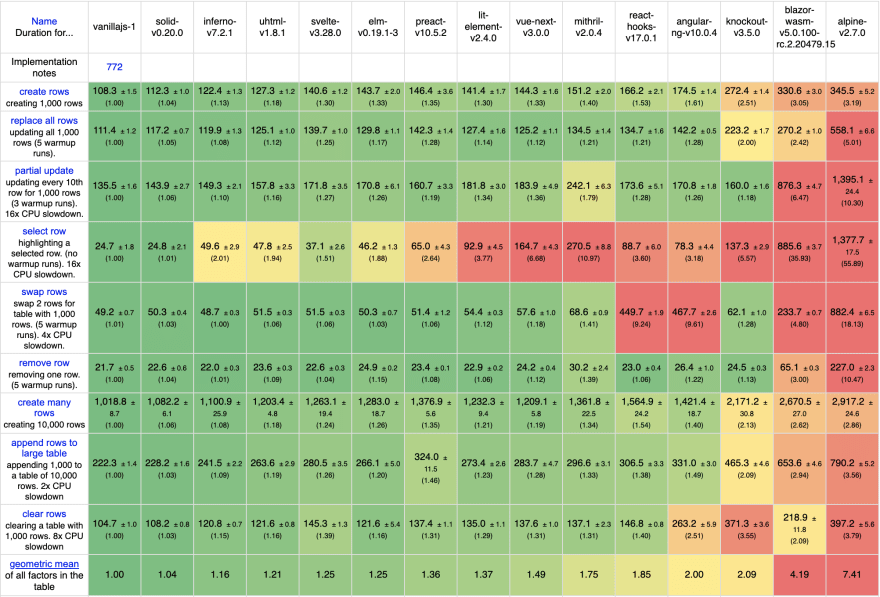
All scores include a score normalized to the fastest implementation in parenthesis right under them. And that is used for the last row to form a geometric mean to rank the libraries.
Note on Categorization: I suggest focusing on Keyed results as while Non-Keyed benefits in a few edge cases it generally is seen as a dangerous practice. More here.
Performance
The first 9 tests focus on performance. They are run on the Chrome Driver work under throttled CPU similar to the lighthouse mobile tests. This emphasizes the overhead as if run on slower devices. They also all run after the initial page load so they aren't influenced by any network/bundle size considerations. There are other tests later to measure that.
1. Create Rows
Creates 1000 rows. This test measures the cost of rendering 8000 DOM elements. Every library creates the same 8000 elements so this is a good indicator of the pure creation time. Here is where you feel the cost of setting up bindings or creating any additional constructs the library will use.
2. Replace Rows
Similar to the first but this one replaces 1000 rows already rendered. This test is a combination of creation time plus disposal overhead. While it contains both its biggest value is understanding how the library performs when most of the content on the page changes. In the case of a table, the library must confirm every row has been removed in addition to creating all the new content.
3. Partial Update
This is a nested data update on every 10th row. Why every 10th row? This gives us enough change to track while ensuring that most rows are not updated. Depending on the library some can detect only that specific piece of data has changed, whereas others need to run all the array comparison code. This test is the best indicator of things like animation performance and the overhead of deep nested data structures. Basically this test taxes the dynamic part of the libraries templating.
4. Select Row
This tracks the change of selection state between 2 rows. It is implemented with a single selectedRow state. It tests the cost of delegating state change over all rows. The DOM operations here are minor compared to the overhead of the library checking whether each row is selected or not. Where test 3 is a good indicator of ideal partial update performance this row indicates the cost of naive partial update performance.
Note: If you see libraries marked with issues the vast majority are related libraries that have come up with creative ways around this test doing what is intended. Sometimes it is out of necessity since the library has no mechanism to do declarative updates.
5. Swap Row
This test swaps the 2nd row with the 999th row. This is the only test that purely tests the overhead of how the library diffs lists. Unfortunately, this test is too simple to really illustrate diffing performance and provides binary results. The library either does naive iteration or smart. It might not matter much as this is based on the number of rows and you probably should be doing something else if you have this many.
6. Remove Row
This test removes a single row from the 1000 row list. This test is probably the least varying test as it more tests the browsers layout shift (as all the rows move up) than any overhead of the library.
7. Create Many Rows
This test is the first one again except this time with 10,000 rows. Yep that 80,000 DOM elements. While a complex UI might have 8000 elements, this number is completely absurd. This test is all about creation like the first. It is a bit more susceptible to memory overhead and scales a lot worse for libraries that are more inefficient.
8. Append to Large List
This test adds 1000 rows to 10,000 previously rendered rows. This tests the overhead of processing diffing when the list already has many items in it. Many libraries are quick to create but much slower to compare. This tests the ability of the library to perform incremental additions as pages scale.
9. Clear Rows
This removes all 1000 rows in one action. This illustrates the cost of the library's cleanup code. Identifying that all the rows need to be cleared is usually trivial (data.length === 0) but libraries that use methods to optimize updates need to clean up here. Memory usage impacts this test a lot as there is more for the browser to GC. This is a more direct measurement of that overhead over test 2 which also does creation at the same time.
Startup Metrics

The benchmark also uses Lighthouse with mobile simulation to test loading scores for the library. These are only an approximation but this section does give us some useful information.
1. Consistently Interactive
This is a pessimistic TTI that waits for the CPU to be idle for 50ms. Unless your library is giant the score spread isn't that large here and seems to mostly scale with bundle size with the exception of WASM libraries that don't seem to take a hit (with exception of Blazor). I'm gathering JS parsing time is a large part of this test.
2. Script Bootup Time
This tests the time spent evaluating page scripts and is probably the least useful of the whole benchmark as it is capped by frames (best score is 16ms) and while some libraries do worse here it can also be a bit variable on whether it gets processed in a single frame or not. There is a correlation to size but it isn't strict.
3. Total Kilobyte Weight
This measures the total size of all assets including user code, HTML, and CSS. This is useful since it shows real build sizes versus package sizes. A library like Preact might be 4kb gzipped but a library that more aggressively tree shakes might be double the size on paper but several kb smaller here. There are some libraries smaller than the VanillaJS implementation.
Memory
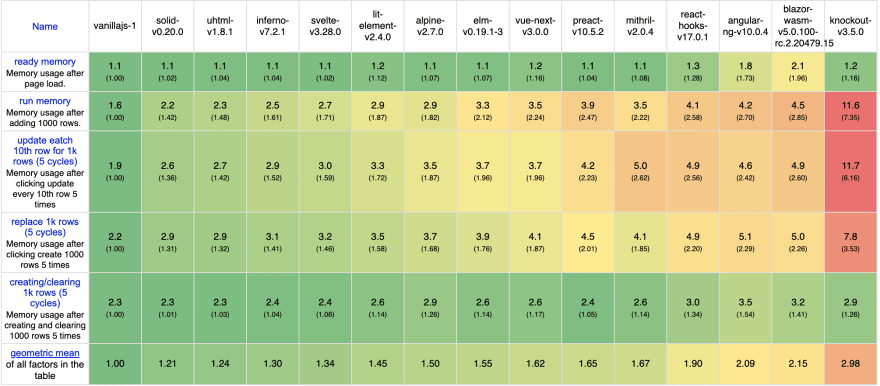
This might be the metric that we can make the least judgement on but it helps paint a picture of the overall performance. If nothing else it helps more than a few library authors realize large memory leaks in their libraries. And might serve as a constraint on low spec devices.
1. Ready Memory
This is the memory reading right after the page has loaded. With no more than a couple of buttons on the page, this memory number is low and most libraries actually do pretty similarly here.
2. Run Memory
This is the memory reading right after creating that first 1000 rows (same as Performance Test 1). This is the overhead of all the extra DOM nodes and the dynamic library constructs. It is the first indicator of how heavy the library's runtime is.
3. Update every 10th row
Same as Performance Test 3 but this time we see the memory overhead of doing partial updates. Mostly this is the allocation of new string values but you get to first time see memory overhead of libraries dynamic diffing mechanisms.
4. Replace Rows
Similar to Performance Test 2 this replaces the 1000 rows 5 times. You would think memory should be similar to the Run Memory test but it appears there is always some overhead, even for VanillaJS when creating and clearing at least once. This is a good test to detect memory leaks.
5. Create/Clear Rows
Similar to Performance Test 9 this creates and then clear 1000 rows. This you would think ideally should get us back to our baseline memory usage. But as shown even by VanillaJS there is an overhead. The closer the libraries get to VanillaJS numbers the more effective they are at cleaning up after themselves.
Viewing the Results
This benchmark lets you really narrow down what you are looking for down to test, implementation and even different view modes. Comparison mode is particularly useful because it visually shows statistical significance.
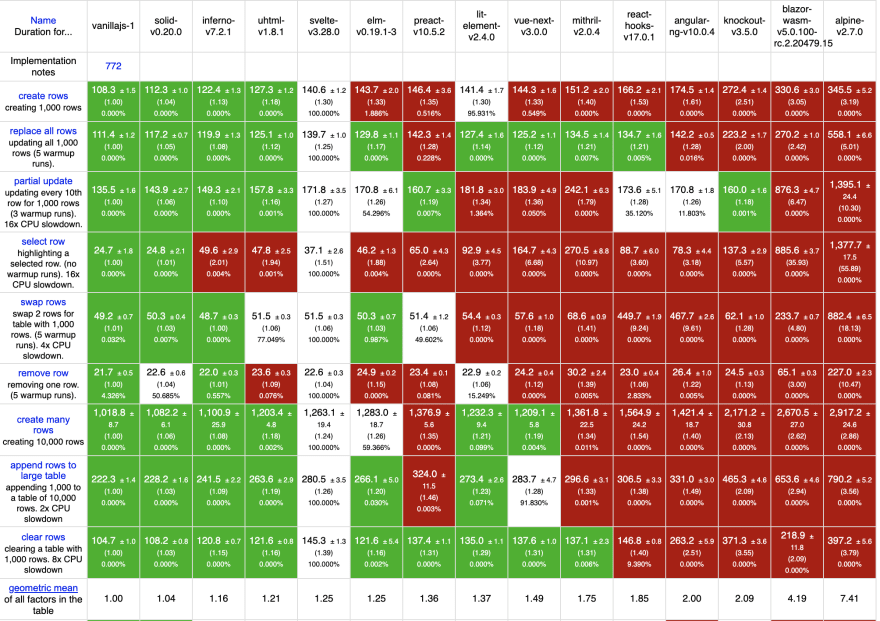
Here I am comparing the selected libraries to Svelte. You can see libraries that where results are comparable the cells are white; where a library is significantly more performant it is green; and where the library is significantly less performant the results are red.
Every test is different so it can help you get a holistic view. In many ways, libraries are close in performance on many of the metrics so there is usually a pretty big gap in performance before things are actually significant across the board. It isn't until we get to Angular that we see things significantly slower, or until we get to Solid that we see things significantly faster.
There is also a box plot view that really helps chart the variance. This can be useful to look into a single test and understand how consistent its results are.

Putting it in Perspective
Benchmarks are only one side of the story. They should be always viewed with skepticism, but not contempt. I think when you come across well maintained and well thought out benchmark you can learn a lot about how a library behaves.
A benchmark like the JS Framework Benchmark is more unforgiving in some ways and more lenient in others. This test is heavily constrained by DOM operations which really only affect real apps on large page navigations. Given these implementations are most optimal the rest of the cost is disproportionally tied to library execution time.
In real applications it is the user code that often takes up more of the time. It's easy for us to blame the framework and benchmarks support this narrative. So by all means, if you believe your code is immaculate seek out the fastest libraries here. In reality there is much more to it than this.
There is no such thing as a real-world benchmark and most attempts fall a bit shallow. Like focus on only initial page load. However, you are in the market for benchmarks this is one of the best ones out there.
Original Link: https://dev.to/ryansolid/making-sense-of-the-js-framework-benchmark-25hl
Dev To
More About this Source Visit Dev To