
An Interest In:
Web News this Week
- April 24, 2024
- April 23, 2024
- April 22, 2024
- April 21, 2024
- April 20, 2024
- April 19, 2024
- April 18, 2024
Some of Our Sources
- Slashdot
- Techcrunch
- Technology Review
- Just Creative
- Pearsonified
- Fuel Your Creativity
- Web Designer Depot
- Line 25
- Wal You
- Design Modo
Help Webnuz
Referal links:
Complete Prometheus Monitoring Tutorial for Beginners
This complete Prometheus tutorial consists of 3 parts and is a detailed guide to getting started with Prometheus in your Kubernetes cluster.
- How Prometheus Monitoring works and its Architecture explained
- Setting up Prometheus in your Kubernetes cluster
- Steps to monitor any third party app using Prometheus
Part 1: How Prometheus Monitoring works? Architecture explained
In the first part you will learn all the basics from what Prometheus is to understanding the whole Architecture and Components:
- What is Prometheus?
- Different use cases of where and why Prometheus is used
- Why it's such an important tool in modern infrastructure
- What are targets and metrics?
- How does Prometheus collect those metrics from its targets?
- I explain Prometheus Architecture with simple diagrams and go through the main components: Prometheus Server, Pushgateway, Alertmanager, Prometheus Data Storage
- See an example configuration
- Look at some Key Characteristics why Prometheus became so popular, especially in containerized environments
Prometheus Server Components:
Part 2 - Demo: Setup Prometheus in your Kubernetes cluster
In the second part you will learn how to setup Prometheus Monitoring and Grafana in your Kubernetes cluster.
In general there are 3 ways to do the setup:
1. Create all the Kubernetes configuration files yourself
This way is pretty inefficient and it's a lot of effort.
2. Using a Kubernetes Operator
With this option you would go and find an operator for Prometheus and deploy it in the cluster using the configuration files of the operator. It is more efficient.
3. Using Helm chart to deploy the Prometheus Operator
This is the most efficient way. Prometheus Operator has a Helm chart that is maintained by the Helm community. You can use this Helm chart to deploy the operator.
So, Helm will do the initial setup. Operator will then manage the running Prometheus setup.
In the demo I show you the third way. We will easily deploy Prometheus and Grafana using Helm chart for Prometheus Operator.
Walkthrough of the different components created: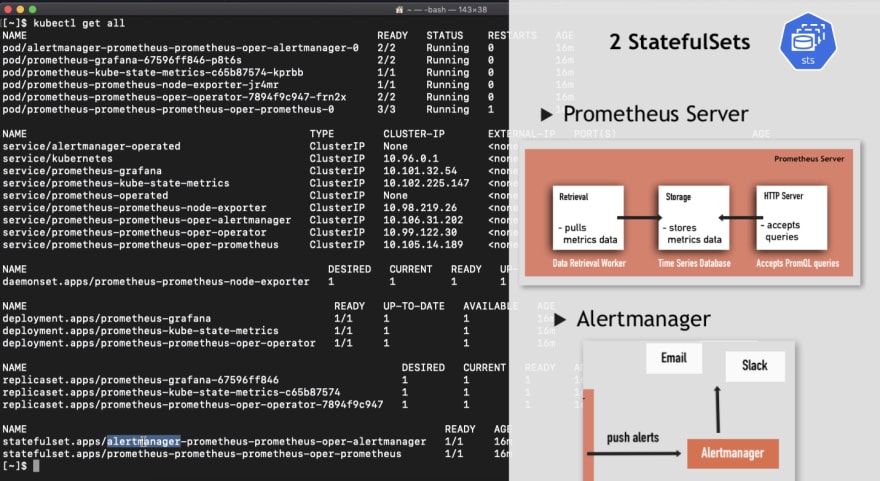
I walk you through the different components, which were created, so that you have a good understanding of what they are and what they do.
Part 3- Demo: Steps to monitor any third party app using Prometheus
A typical scenario would be that you have an application deployed in your Kubernetes cluster and at some point you decide that you want to monitor it using Prometheus.
So in the 3rd part you learn how to monitor any third-party application in your Kubernetes cluster using Prometheus Monitoring.
In the demo I deploy MongoDB as an example, but the concepts you learn here can be applied to any other application like Mysql or Redis.
Steps to monitor third-party apps in Promoetheus: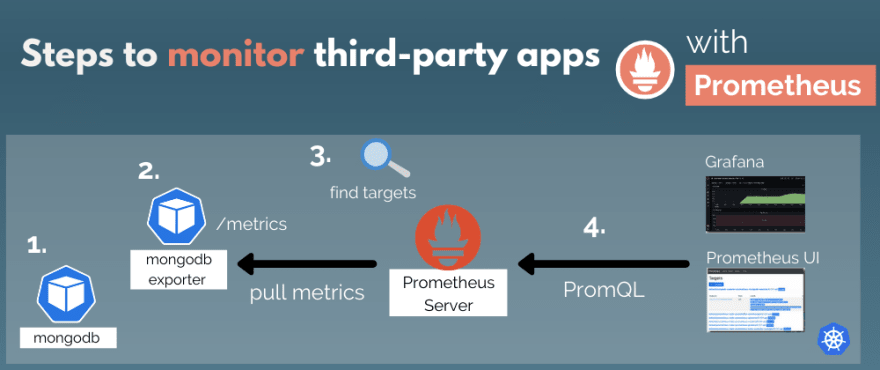
- Deploy MongoDB Application using K8s Deployment and Service
- Expose metrics using MongoDB Exporter
- Allow Prometheus to scrape metrics using ServiceMonitor
- View the scraped data in Prometheus UI and Grafana
Hope this hands-on tutorials will help you in getting started to use Prometheus at your work or projects
Get 30% off - with this code: UDEMYNANA_SEPT2020: Udemy course - Logging in Kubernetes with EFK stack
Kubernetes 101: Compact and easy-to-read ebook bundle
It's a handy way to quickly look something up or refresh your knowledge at work and use it as your cheatsheet
Like, share and follow me for more content:
Original Link: https://dev.to/techworld_with_nana/complete-prometheus-monitoring-tutorial-for-beginners-eoe
Dev To
More About this Source Visit Dev To