
An Interest In:
Web News this Week
- April 20, 2024
- April 19, 2024
- April 18, 2024
- April 17, 2024
- April 16, 2024
- April 15, 2024
- April 14, 2024
Some of Our Sources
- BoingBoing
- Simplebits
- Just Creative
- Fuel Your Creativity
- Noupe
- Specky Boy
- CSS Tricks
- Design Modo
- Dev To
- The Verge
Help Webnuz
Referal links:
Beginner's guide to Elasticsearch
In life, we are always in search of something. Whether we are in search for the meaning of life or in search for the most delicious tacos in town, we heavily rely on search engines to get the answers.

You may already use some of the most powerful search engines such as Yelp, Uber, or Wikipedia on a daily basis. But did you know that these search engines were built with Elasticsearch?

Elasticsearch is a distributed, open source search and analytics engine for all types of data. It is known for its speed and scalability. Combined with its ability to index many types of content, Elasticsearch is used for numerous use cases such as application search, enterprise search, application performance monitoring, and security analytics to name a few(paraphrased from Elastic).
If you are a developer who is looking to make data usable in real time and at scale, Elasticsearch is a great tool to have on your belt.
Elasticsearch is known as the heart of the Elastic Stack, which consists of Beats, Logstash, Elasticsearch, and Kibana.
Together, the Elastic Stack allows you to take data from any source, in any format, then search, analyze, and visualize it in real time(excerpt from Elastic). We will specifically focus on Elasticsearch.
By the end of this blog, you will be able to:
- understand how the components of Elastic Stack work together to search, analyze, and visualize data in real time
- install Elasticsearch and Kibana to run queries
- understand the basic architecture of Elasticsearch
- discuss how sharding and replication contributes to Elasticsearch's scalability and reliability
How do the components of Elastic Stack work together and how are they integrated into your app?
Elastic stack consists of Beats, Logstash, Elasticsearch, and Kibana.
The best way to understand how these components work together is to put these into context of a real life project. These components are usually mixed and matched to serve your specific use case. For the purpose of this tutorial, we will go over a scenario that uses them all.
Imagine you are the lead developer responsible for the hottest outdoor gear e-commerce site. You currently have a full stack app connected to a database.
Millions of customers are searching for products on your site but the current architecture is struggling to keep up with search queries submitted by users.
This is where Elasticsearch comes in.

You would connect Elasticsearch to your app. When a user sends a search query on your website, the request is sent to the server. The server in turn, sends a search query to Elasticsearch.
Elasticsearch sends the search results back to the server, which processes the info and sends the result back to the browser.
At this point, you might be wondering how do we get data into Elasticsearch?
That is where Beats and Logstash come into play.
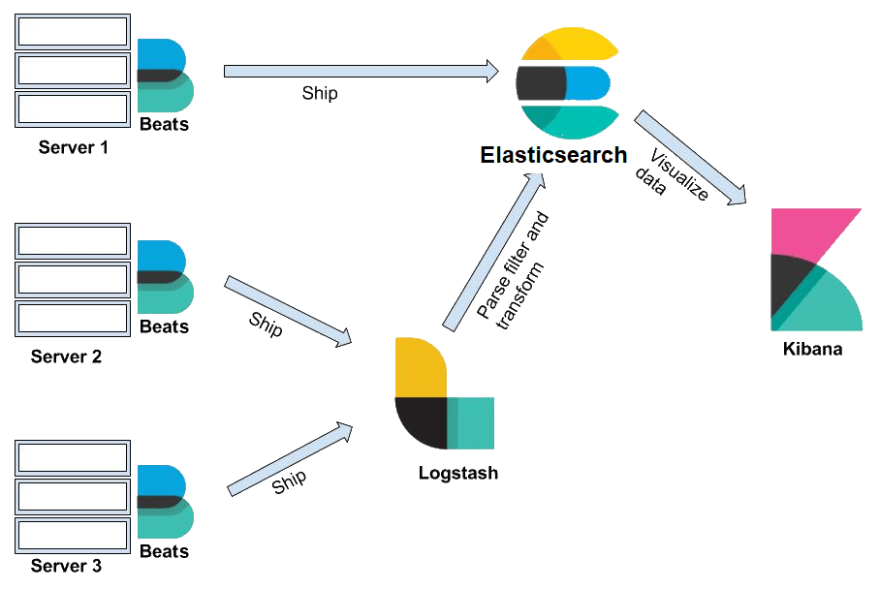
Beats is a collection of data shippers. When installed on your server, it collects and ships data to either Logstash or Elasticsearch.
Logstash is a data processing pipeline. Data that logstash receives(i.e. e-commerce orders & customer messages) are handled as events. These events are parsed, filtered , and transformed and are sent off to Elasticsearch where the data will be stored.
In Elasticsearch, data is stored as documents, a unit of info that is stored in JSON object. A REST API is used to query these documents.
We will delve more into Elasticsearch in a bit. For now, know that it is responsible for performing searches and analysis on large volumes of data.
All the search and analysis on data would prove useless if we could not visualize it and gain insights from it!
Kibana provides a web interface to the data stored in Elasticsearch. It allows users to send queries to Elasticsearch using the same REST API. These queries can provide answers to questions such as "How many users visit our site daily?" or What was the revenue for last month?"
Through Kibana dashboard, users can visualize the query results and gain insights from the data as shown below!
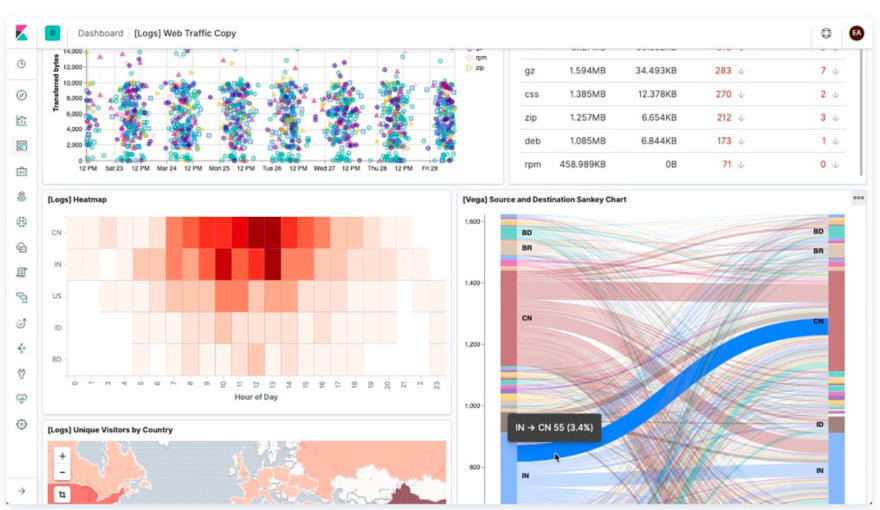
Image source: Elastic
Now that we have an understanding of how components of Elastic Stack work together, let's delve more into Elasticsearch!
First, we will install Elasticsearch and Kibana to help us visualize and consolidate the concepts we will cover in this tutorial.
Installing Elasticsearch
To keep the blog brief, I will only be going over installation directions for Windows. But don't worry! The installation steps for different operating systems are very similar and there are a lot of installation videos on line in case you run into trouble.
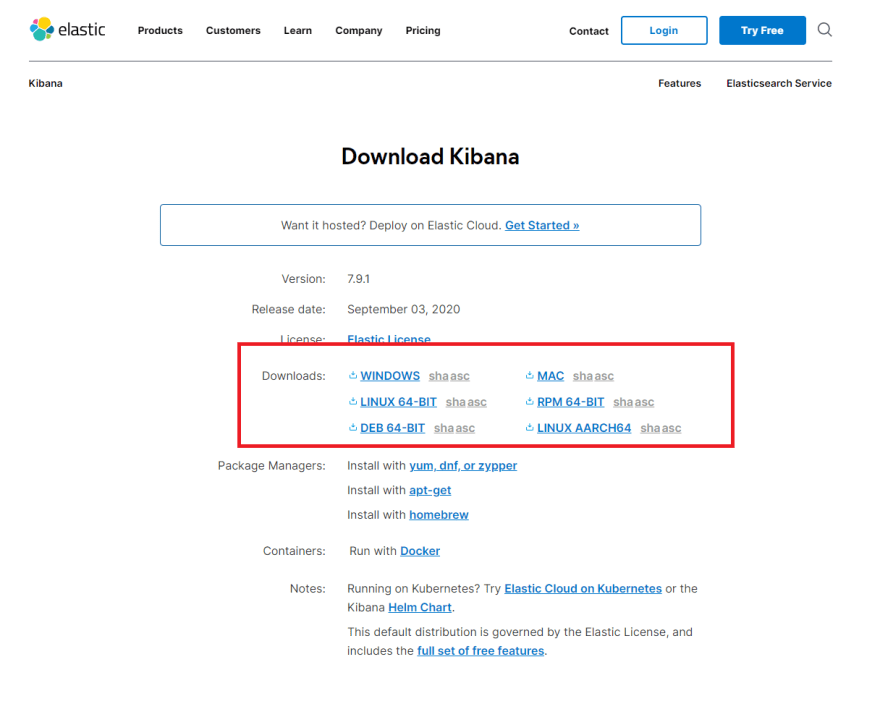
Step 1: Download Elasticsearch
Go to the download link.
In the region highlighted with a green box, select the download option for your operating system.

You will see that a zip file has been downloaded(orange box).
If you scroll down the page, you will see the installation steps. We will be using the commands specified in these steps to test whether Elasticsearch server is running smoothly.

Step 2: Relocate the downloaded file and extract the file
Where you relocate this file is up to you but for this tutorial, I have created a folder called Elastic_Stack in my Windows(C:) drive.
Move the downloaded file to Elastic_Stack folder.
Right click on the file to display pop up options and click on extract all option. Once the file has been extracted, double click on the file. You will see the following displayed on your screen

Double click on the file.
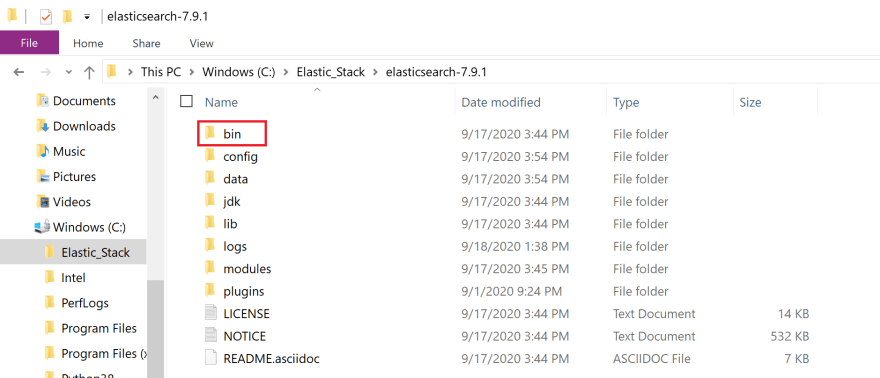
Click on bin folder(red box).

Click on the region highlighted with a green box. It should reveal the file path to the bin folder. Copy this address. We will be using it in the next step.
Step 3: Start the Elasticsearch server and ensure that everything is working properly

Search for the Command Prompt App on windows(purple box) and click on run as administrator option(red box).
In the Command Prompt App terminal, change into the bin directory(cd) by providing the file path to the bin folder. This is the file path you have copied in the previous step.
#In command prompt terminalcd filepath to bin folder in Elasticsearch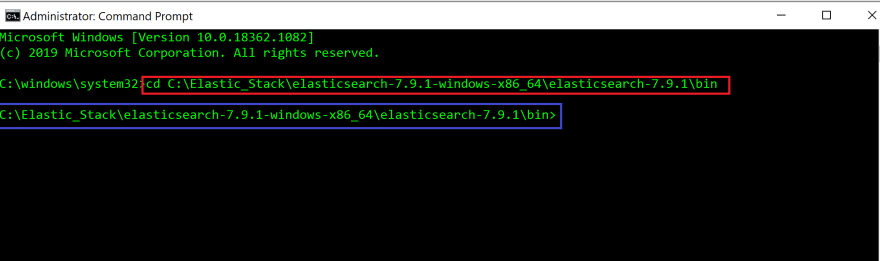
Red box highlights the command we have used to change to the bin directory.
When you press enter, you will see that you have changed into the bin directory(blue box).
In the terminal, run the following command. If you are running on a non-window OS, then run elasticsearch in the terminal instead.
#In command prompt terminalelasticsearch.batYou will see the cursor blinking for a while before you see Elasticsearch server running!

You will see that Elasticsearch server is running on localhost at port 9200(red box).
Let's recap real quick. When a user(client) sends a request to the server, the server sends a search query to the Elasticsearch server. A REST API is used to query the documents and this query is sent to the endpoint http://localhost:9200.
We will use cURL command line tool to check whether the request is received by Elasticsearch server.
Open up a new command prompt window(red box).

In the new terminal, run the following command.
#In new command prompt terminalcurl http://localhost:9200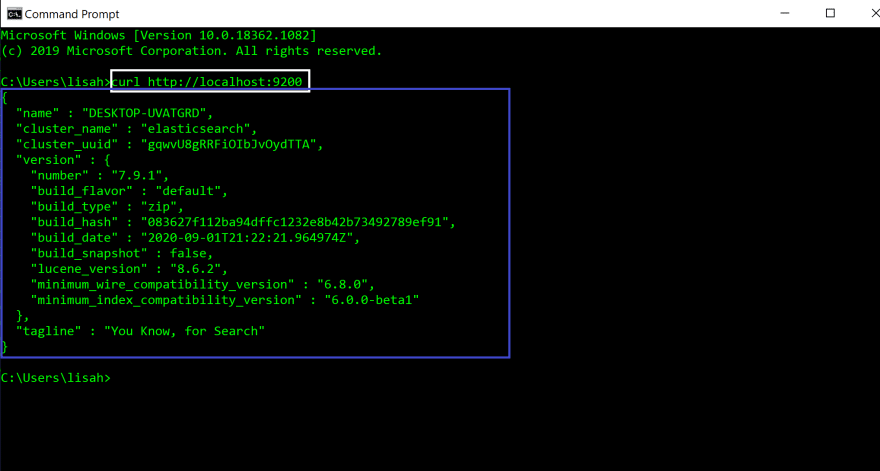
When you run the command(white box), you will see the following JSON object displayed in your terminal(blue box). That means everything is working correctly and Elasticsearch was successfully installed.
Leave these terminals open to keep the Elasticsearch server running.
Installing Kibana
Installing Kibana is very similar to installing Elasticsearch.
Step 1: Download Kibana
Kibana is a web interface for Elasticsearch. However, it ships with its backend server that communicates with Elasticsearch.
Go to the download link.
In the region highlighted with a red box, select the download option for your operating system.
You will see that a zip file has been downloaded.
If you scroll down the page, you will see the installation steps. We will be using the commands specified in these steps to test whether Kibana server is running correctly.

Step 2: Relocate the downloaded file and extract the file
Move the downloaded file to Elastic_Stack folder.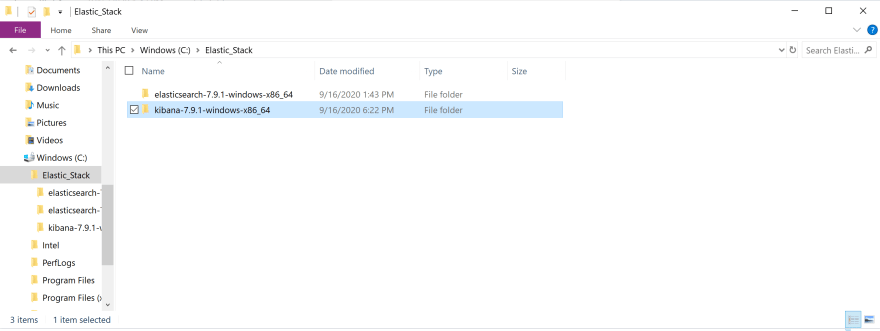
Right click on the file to display options and click on extract all option. Once the file has been extracted, double click on the file.

Click on bin folder(red box).

Click on the region highlighted with a green box. It should reveal the file path to the bin folder. Copy this address. We will be using it in the next step.
Step 3: Run Kibana and ensure that everything is working properly
First, go back to the command prompt window that is running the Elasticsearch server. Make sure it is still running and it is not displaying any error messages.
Open up a new command prompt window.
In the Command Prompt App terminal, change into the bin directory(cd) of Kibana by providing the file path to the bin folder. This is the path you have copied from the bin folder in the previous step.
#In command prompt terminalcd filepath to bin folder in Kibana 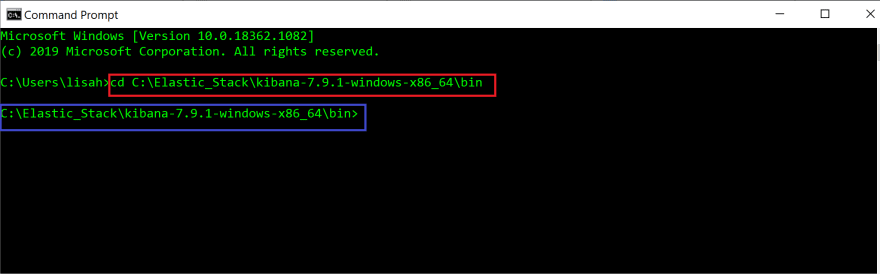
The command has been highlighted with a red box.
When you press enter,you will see that you have changed into the bin directory(blue box).
In the terminal, run the following command. If you are running on a non-window OS, then run kibana in the terminal instead.
#In command prompt terminalkibana.batYou will see the cursor blinking for a while before you see Kibana running!

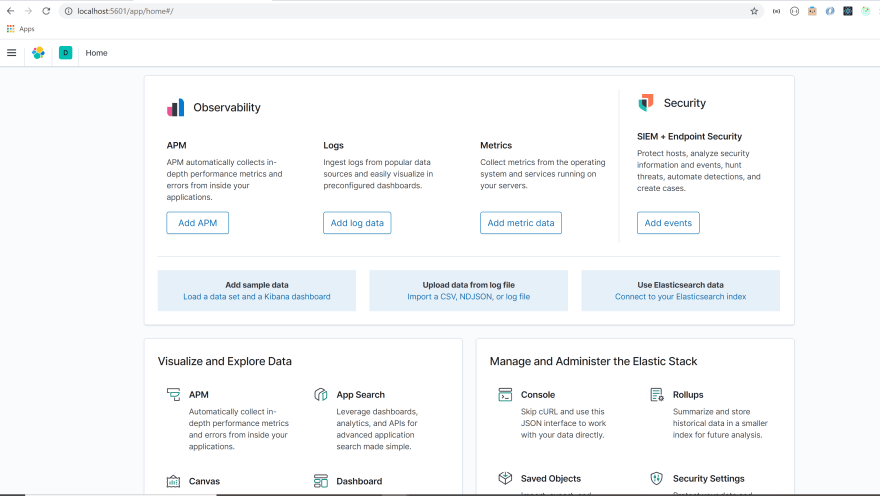
Open up a browser and go to http://localhost:5601.
You will see the following displayed on the browser.
Troubleshooting
If you are having trouble getting Kibana to work, try restarting your Elasticsearch server. Go to the command prompt terminal used for your Elasticserach server. Press `control + c`. Then, run elasticsearch.bat in the same terminal. Go back to your command prompt terminal for Kibana. Run `control + c` in the command prompt terminal. Then, run kibana.bat in the terminal. Go to http://localhost:5601 on your browser. All right let's get back to the Kibana browser.

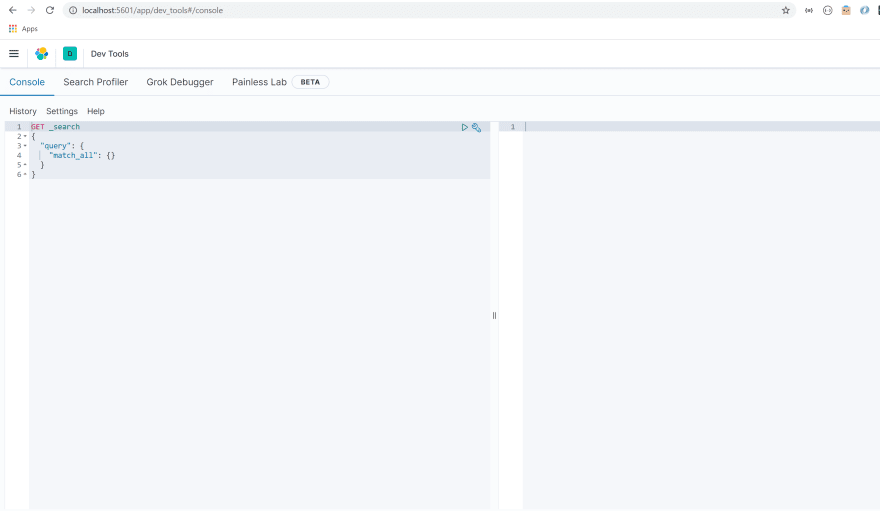
Click on the menu option(red box) to display a drop down menu. Scroll down to management section and click on Dev Tools option(green box).
This tool allows us to easily send queries to Elasticsearch.
All right, now that we got installations out of the way, let's delve into the basic architecture of Elasticsearch! We will be using Kibana to look under the hood of Elasticsearch.
Basic architecture of Elasticsearch
Elasticsearch is a powerful search and analytics engine known for its distributed nature, speed, and scalability. This is due to its unique architecture.
This diagram from exo-archives does a great job of illustrating the architecture of Elasticsearch.

I am gonna make some changes to this diagram to break down this diagram into bite sized pieces.
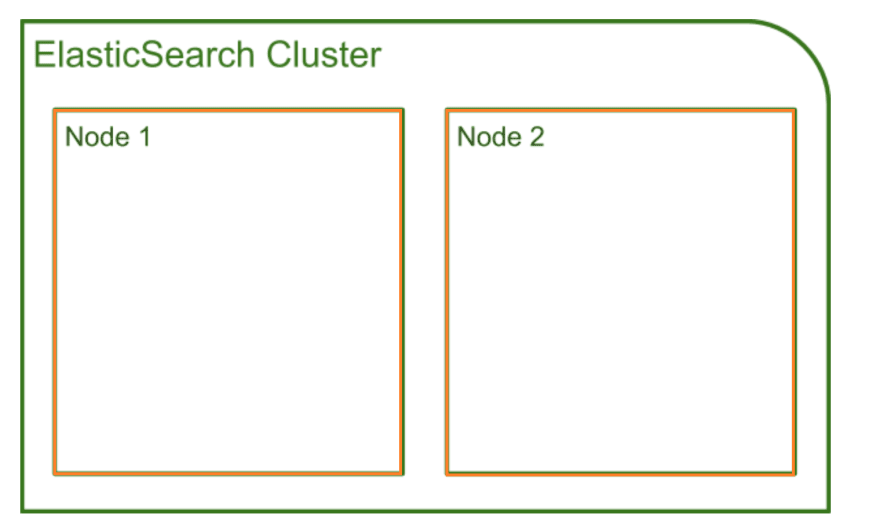
We have just downloaded and ran a Elasticsearch server. Little did we know we were starting up a node(orange box)! A node is a running instance of Elasticsearch that stores data.
Each node belongs to a cluster, which is a collection of nodes that are connected together. When we started up a node, a cluster was formed automatically(green box).
You can add multiple nodes to a cluster. A node, by default, are assigned all of the following roles: master-eligible, data, ingest, and machine learning(if available). You can configure these roles and give specific roles to certain nodes.
Each node in the cluster can handle HTTP request from client and communication between nodes. All nodes are aware of fellow nodes within the same cluster and can forward HTTP requests to the node designed to handle the request.
How is data stored within the node?
The basic unit of data stored in Elasticsearch is called a document. Document is a JSON object that contains whatever data you want to store in Elasticsearch.
For example, let's say you are building an app that helps users find the best food truck in their area. In order to build this app, you will need to store data about food trucks as well as the locations that these trucks like to frequent.
A document storing data about one food truck would look like the following.
{ "name": Pho King Rapidos, "cuisine": Vietnamese and Mexican fusion}Imagine if we had data about millions of food trucks. How would we be able to quickly search through the data to find the one we are looking for?
Searching for data is very similar to searching for a food item at a grocery store. Your search will be way more efficient if all the food items in the store were organized into specific aisles(fresh produce, meat, dairy, condiments & etc).
Documents are organized in a similar way. Every document is stored within an index. An index is a collection of documents that share similar traits and are logically related to each other, much like an aisle of a grocery store.
The node for our food truck app would look something like the following:

The cluster contains multiple nodes. Within nodes, relevant documents are organized under indices.
As we would go to the produce aisle to find an apple, we would run search queries against the indices when searching for documents.
All right, let's look under the hood of Elasticsearch and see how we can get information about the node and cluster we have just created.
Elasticsearch cluster exposes a REST API which receives HTTP requests. We can access this REST API with any HTTP client such as Postman or cURL but we will be using the Kibana Dev Tool to do so.
Open up your Kibana Dev Tool. You should see the following on your screen.

We will start by checking the health status of our cluster.
Delete the content in the region highlighted in grey so we can write our own query.
The syntax of the query is very simple. You initiate the query by specifying an HTTP method(GET, POST, PUT, DELETE). Then, we specify the API we want to access and what we would like to accomplish(command).
In this case, we want to retrieve(GET) the health status of our cluster. We specify that we want to access the cluster API and we want information about its health.
So our query should look like this:
GET /_cluster/healthCopy and paste the query in the region highlighted with a red box.
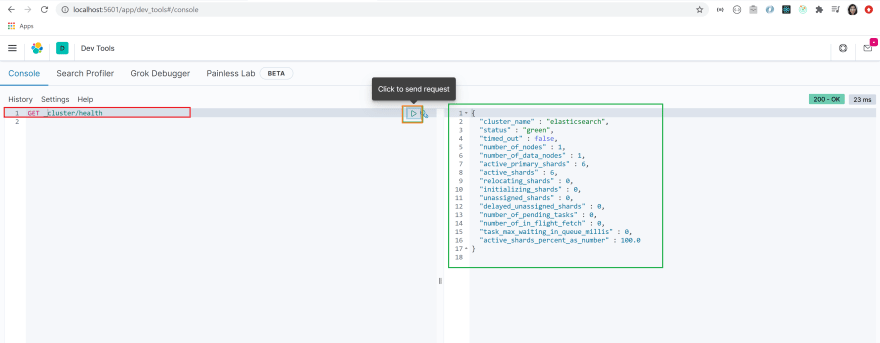
Make sure the query is selected by clicking on it. Run the query by clicking on the arrow highlighted with an orange box.
You will see that a JSON object has been returned to you(green box). You can see that the name of the cluster is set to elasticsearch by default and the status of the cluster is set to green.
This means that our cluster is healthy!
Let's get a list of nodes that are in our cluster.
In order to get this information, we use the _cat API. The query syntax is very similar to the query we have just sent.
We will send a GET request to the _cat API and we will use a command nodes?v to get the list of nodes in our cluster.
Your query will look like the following:
GET /_cat/nodes?vCopy and paste the query into the dev tool. Select the query and send the query by clicking on the arrow.

You will see that basic info about the single node we have is displayed on the screen. It includes information about node's IP address, name, roles as well as some performance measures.
Great job! It looks like our node and cluster have been created successfully.
Let's create an index for food_trucks.
You can create an index by specifying the PUT method followed by the name of the index.
Run the following query in the dev tool.
PUT food_trucks
You will see a JSON object returned to you. It will specify that an index named food_trucks have been successfully created.
You will also see that the value of shards_acknowledged is set to true. We will cover this shortly!
Armed with basic understanding of Elasticsearch architecture, we are now ready to understand what factors make Elasticsearch so scalable and reliable!
Understanding the factors behind Elasticsearch's scalability and reliability
What is sharding?
In the previous step, upon creating an index, we saw that shards_acknowledged value was set to true. What is a shard anyway?
Elasticsearch is known to be extremely scalable. It could adapt to support an increasing amount of data or demands placed on it. One of the factors that give Elasticsearch its scalability is a practice called sharding.
Let's say that an index containing documents about food trucks contain about 800 gigabytes of data. We have two nodes in our cluster and each has 400 gigabytes available for storing data.

But wait a minute... Our entire index will not fit into either one of these nodes. If only we could divide the index into smaller chunks and store it across the nodes...
Well, that is exactly what sharding is! Sharding divides indices into smaller pieces called shards. A shard contains a part of index's data and can be distributed across nodes within the cluster.
So the 800 gigabytes of data in our index can be divided into four shards, each holding 200 gigabytes of data. Then, these shards could be distributed across node 1 and 2.
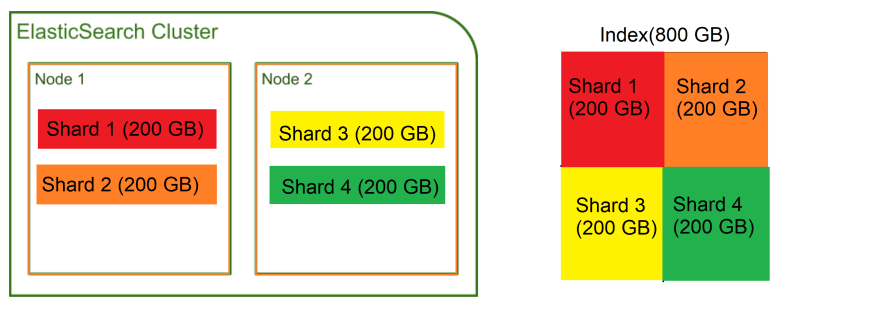
By dividing an index into smaller shards and distributing across nodes, we were able to store an index taking up 800 gigabytes of disk space, despite the fact that we do not have a single node that can store all that data!
Let's say our food truck app took off and we have a user base growing at a breakneck speed. A ton of data is being sent to Elasticsearch for storage.
We do not have to worry about increased data coming in because we can simply add more nodes and change the number of shards for whatever index you are working with!
What is replication?
Our food truck app is gaining some serious momentum. To our horror, one of the nodes goes down, taking its data down them into the dark abyss.

Can you imagine what a nightmare this would be if we had no back up mechanism to deal with something like this?
Thank goodness we have replication!
Replication creates copies of shards and keeps the copies in different nodes. If a node goes down, the copies stored in other nodes would step up to the plate and serve requests like nothing happened.
Elasticsearch automatically replicates shards without us having to configure anything. It creates a copy(replica shard) of each shard within the index.
Remember how we created an index called food_trucks earlier? Let's use Kibana to get more info about our index.
Go to the Dev Tool and run the following query.
GET /_cat/indices?v
If you look at the column, you will column pri and rep(red box). These stand for primary shard(pri) and replica shard(rep).
Let's examine the index food_trucks highlighted with a green box. You will see that upon creating an index, a primary shard and replica shard have been automatically created!
Replica shard is an identical copy of the pimary shard. It functions exactly the same way as the primary shard.
As you should never put all of your eggs in one basket, Replica shards are never stored in the same node as the primary shard. The primary shards and replica shards are distributed across the nodes in a manner shown below.

Even if a node goes down, you can rest easy knowing that replica shard stored in another node will pick up the slack as if nothing had happened!
As you can see, sharding and replication contributes to Elasticsearch's scalability and reliability.
All right, we have achieved all of our end goals! You guys deserve an applause and a long break for getting this far.
Now that you have a solid grasp on important concepts of Elasticsearch, you are now ready to explore more advanced skills like mapping, analysis, and advanced queries. Go explore and see what you can do with Elasticsearch on your own!

Original Link: https://dev.to/lisahjung/beginner-s-guide-to-elasticsearch-4j2k
Dev To
More About this Source Visit Dev To