
An Interest In:
Web News this Week
- March 22, 2024
- March 21, 2024
- March 20, 2024
- March 19, 2024
- March 18, 2024
- March 17, 2024
- March 16, 2024
Some of Our Sources
- Technology Review
- Just Creative
- Abduzeedo
- Naldz Graphics
- Web Design Ledger
- Line 25
- Freelance Switch
- Web Resource Source
- Daily Now
- The Verge
Help Webnuz
Referal links:
How I built architecture of uptime monitoring service
Table of contents
Intro
Requirements
VPS Provider and Servers
Technologies used
How a node works
How the core server works
To sum up
What didn't work
Why it took so long?
Intro
Hi there!
This is my first article so it might not be perfect
Almost a year ago I decided to build an uptime monitoring service, which resulted in https://pingr.io.
It is a web app that continuously checks that your URL responds with 200 OK or any other response code you prefer.
So the idea is pretty straightforward. You might think that it's not that hard to make an HTTP request after all.
But it took me a year.
In this article I want to describe how it works.
I don't claim that the architecture is good.
The architecture is somewhat the compromise between launching your product asap and having excellent architecture.
I didn't want to spend yet another year of making it perfect, since it's pretty hard to keep motivation during the development.
I'd love to hear what can be improved and where I did it completely wrong.
Let's dive in.
Requirements
At first, it seems like it's an easy task to make an HTTP request. However, there are a lot of requirements for what the service should do. Here are some of them:
- The URL should be checked from multiple nodes distributed around the world.
- Minimum check frequency is 1 minute
- You should be able to add new nodes
- Every node should make a decent number of HTTP requests per minute. At first, I was okay with 500-1000. But when the user number grows, it might be much more.
- Apart from HTTP checks, the service should also check SSL certificates (if they are valid/expires soon, etc.)
- The UI showing URL status should be updated in realtime
- The user should be notified of uptime/downtime events via different ways depending on his choice
VPS Provider and Servers
I think that if you want to have your product up and running as soon as possible, it's okay to pay more for services which you you are comfortable with.
So I tried both ScaleWay and Digital Ocean but eventually moved all my servers to Digital Ocean since I liked it more.
What I have:
- Ubuntu VPS with MySQL. 3 GB / 1 vCPU
- 5 Ubuntu VPS which are located in different parts of the world. 3 GB / 1 vCPU
- Ubuntu VPS for the core server. 4 GB / 2 vCPUs
- Redis database: 1 GB RAM / 1vCPU
Regarding MySQL. In the beginning, I used their RDS, since it's meant to be used as a database, and everything should've been cool. But when I wanted to change my.cnf I realized that I couldn't do that. And I like to have control of everything, at least in the beginning while I'm learning.
So, for now, I decided to have just a VPS with MySQL installed since it gives me more control.
Why MySQL? No idea. I've just worked only with this database.
Why Ubuntu? No idea. I've just worked only with this OS.
Technologies I used
- Laravel for backend
- VueJS for frontend
- MySQL for Database
- Redis for queues
- cURL for sending requests (Guzzle library)
- Supervisord for keeping my workers up and running
- ...
- PROFIT!
Listing of artisan commands
When I was writing this article, I realized that it might help a lot if I list all the Laravel's commands which I use here:
php artisan monitor:run-uptime-checks {--frequency=1}- Dispatches uptime checks jobs. Ran by cron everyfrequencyminutesphp artisan checks:push- Fetches check results from the local Redis database to the temporary MySQL table. Kept running continuously by Supervisordphp artisan checks: pull- Fetchs check results from the temporary MySQL table and calculates monitor status/uptime/other indexes. Kept running continuously by Supervisord.
How a node works
This is one of the most important parts of the article, which describes how a single node works.
I should note that I have a Monitor entity, representing a URL that should be checked.
Getting monitors ready for uptime check

The php artisan monitor:run-uptime-checks command fetches monitors from the database based on some conditions.
One of the requirements is uptime check frequency, which means how often we should check the monitor. Not every user wants to check their sites every minute.
Then, using Laravel scheduling mechanisim, it's easy to setup running this command with different frequencies.
Passing frequency as an argument helps me to get only the monitors I need to check, depending on what frequency the user has set.
// In the RunUptimeChecks command, we fetch monitors by frequency specified by the user$schedule->command(RunUptimeChecks::class, ['--frequency=1']) ->everyMinute();$schedule->command(RunUptimeChecks::class, ['--frequency=5']) ->everyFiveMinutes();$schedule->command(RunUptimeChecks::class, ['--frequency=10']) ->everyTenMinutes();$schedule->command(RunUptimeChecks::class, ['--frequency=15']) ->everyFifteenMinutes();$schedule->command(RunUptimeChecks::class, ['--frequency=30']) ->everyThirtyMinutes();$schedule->command(RunUptimeChecks::class, ['--frequency=60']) ->hourly();Filling up the queue
Then I put the uptime check jobs into the Redis queue for every monitor I have. This is what happens in RunUptimeChecks command:
foreach ($monitors as $monitor) { RunUptimeCheck::dispatch( (object) $monitor->toArray(), $node->id );}You may notice here something strange: (object) $monitor->toArray().
At first, I passed the Monitor model to the job. However, there is a significant difference: when you pass a model to a job, it stores just a model id in the queue. Then, when the job is being executed, Laravel connects to the database to fetch the model, which resulted in hundreds of unnecessary connections.
This is why I passed an object instead of the actual model, which serialized quite well.
Another possible approach is removing the SerializesModels trait from the job, which also might work, but I haven't tried that.
So after this operation, we have some number of jobs in the queue ready to be executed.
Running uptime checks

To execute the jobs, we need to run the php artisan queue:work command.
What we also need is:
- Many instances of the command running, because we need to do as many checks as we can per minute
- If the command fails, we need to revoke it and run again.
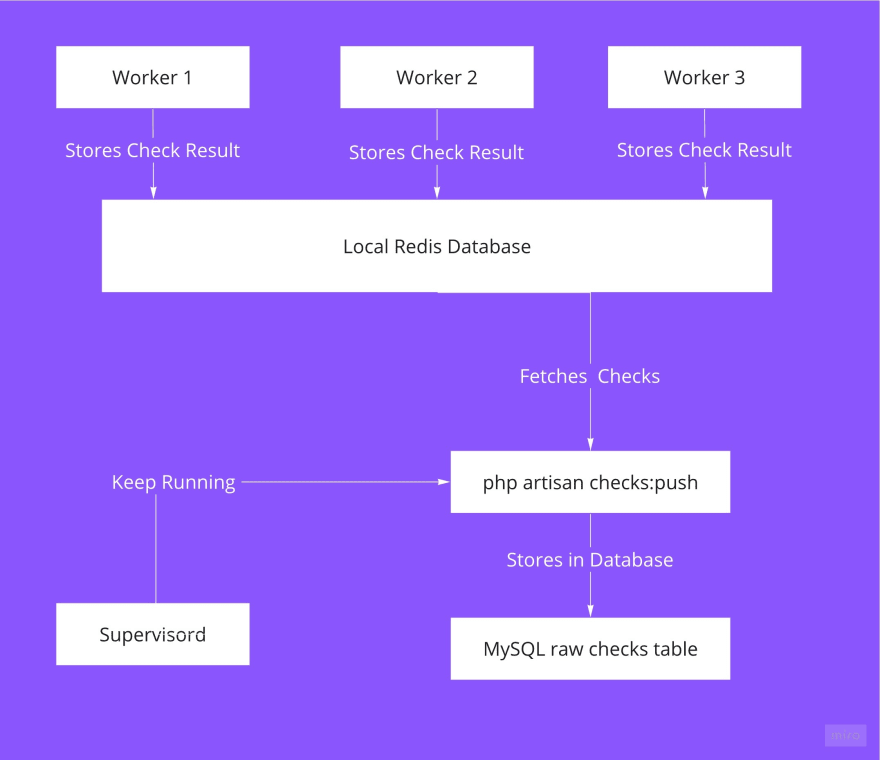
For this purpose, I used Supervisord.
What it does is it spawns N number of PHP processes, every process is queue:work command. If it fails, Supervisord will rerun it.
Depending on VPS Memory and CPU cores, we might vary the number of processes. Thus, we can increase the number of uptime checks performed per minute.
Storing the temporary result
Now, after we ran a check, we need to store it somewhere.
First, I store the check result in the local Redis database.
Since there might be many processes that continuously push data to the queue, it fits perfectly for this purpose, since Redis is an in-memory database and is very fast.
Then I have another command php artisan checks:push that fetches the checks from the Redis database and does the batch insert into the raw_checks MySQL table.
So I got two tables: monitor_checks and raw_checks. The first one contains the latest successful check of a monitor and all of its failed checks. I do not store every check of every node per minute, since it'll result in billions of records and it doesn't provide much value for end-users.
The raw_checks table serves as a bridge between the core server and all nodes servers.
After each check we need to do a lot of stuff:
- Recalculate uptime of every node
- Recalculate the average response time of every node
- Recalculate monitors uptime/response time based on nodes info
- Send notifications if needed
It would be much more reasonable to fetch many checks at once and do all calculations on a server located close to the MySQL server.
For example, the connection between the Indian node and the MySQL server located in Germany is relatively slow.
So the aim is to make the nodes as independent as they can be.
All they do regarding MySQL connection is: fetch monitors which should be checked & store results of checks. That's it.
How the core server works

At the core server, I run the php artisan:checks-pull command, which behaves like a daemon: it has an infinite loop that fetches checks from the raw_checks table and calculates such things as average uptime, response time, and some others.
Apart from that, it is responsible for queueing jobs for downtime notifications.
That's actually it: we have monitors with updated status, uptime & response time attributes.
Updating realtime data
In order to update monitor status on the web app, I use Pusher and Laravel's broadcasting feature.
So the setup is straightforward.
php artisan checks:pullgets a check from the raw table, sees if the monitor is online, and if it's not, it fires theMonitorOfflineevent, which is broadcasted using Pusher.Web app sees the new event from Pushed and marks the monitor as offline
To sum up
So, to sum up:
- Every node has a cron job, which fetches the monitor list and put the uptime check jobs into the local Redis queue
- A lot of threads ran by Supevrisord check the queue and make the HTTP requests
- The result is stored in Redis
- Then bunch of checks stored in local Redis moved to the raw checks table in the MySQL server
- The core server fetches the checks and do the calculations.
Every node has the same mechanism. Now, having a constant stream of checks from the raw table, the core server can do many things like calculated average response time from a node, etc.
If I want to extend the number of nodes, I'll just clone the node server, do some small configuration, and that's it.
What didn't work
At first, I stored ALL checks in the database. Both failed and successful. It resulted in billions of records. But users mostly don't need it. Now instead, I have an aggregation table which stores uptime and response time by an hour
At first, the uptime check job did all the logic itself: I didn't have any temporary/bridge databases. So it connected to the MySQL server, calculated new uptime etc. Which immediately didn't work as soon as the number of monitors increased up to ~100. Because every check job did maybe 10-20 queries. 10-20 queries * 5 nodes * 100 monitors. So yeah, it wasn't scalable at all
Using a dedicated Redis server instead of the
raw_checkstable. Since the raw checks table behaves like a cache, it might be reasonable to consider using Redis for this purpose. But for some reason, I kept losing checks data.
I tried both the sub/pub features of Redis and just storing the data. So I gave up and used a mechanism that is familiar for me: MySQL.
Also, I think I've read somewhere that Redis is not the best solution if we need 100% confidence in storing data.
Why did it take so long?
Because of multiple factors.
- I work at a full-time job, so I could work only in the evenings.
- I haven't had such experience before. Every project is a unique one.
- I had some psychological problems which I've described in this article
- I've checked many different ways of making this work with a high number of monitors. So I was kind of rebuilding the same thing many times
- Take into account that I also built a UI and did everything alone.
Original Link: https://dev.to/vponamariov/how-i-built-architecture-of-uptime-monitoring-service-54h8
Dev To
More About this Source Visit Dev To