
An Interest In:
Web News this Week
- April 20, 2024
- April 19, 2024
- April 18, 2024
- April 17, 2024
- April 16, 2024
- April 15, 2024
- April 14, 2024
Some of Our Sources
- BoingBoing
- Techcrunch
- Six Revisions
- Vandelay Design
- You The Designer
- Creative Curio
- Fuel Your Creativity
- Web Designer Depot
- Line 25
- Daily Now
Help Webnuz
Referal links:
COVID 19 DASHBOARD IN 7 EASY STEPS
Project Objective
This project aims to build a simple COVID -19 dashboard to analyze and represent the location-wise statistics.
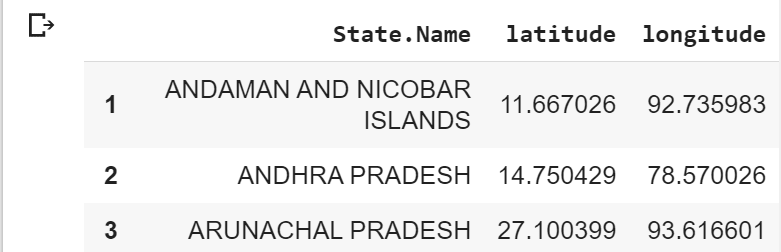
State_With_Loc
The data frame (State_With_Loc) consists of the state name, latitude, and longitude of the respective states. e.g. Figure 1.
Note: Its fixed in nature hence no need to consume from the dynamic table.
State_With_Covid_Data:
The latest State-wise situation
API Link: 'https://api.covid19india.org/csv/latest/state_wise.csv'
The data frame (State_With_Covid_Data) consists of the state COVID parameters such as:

- State: Name of the State.
- Confirmed: Count of confirmed cases.
- Recovered: Count of recovered cases.
- Deaths: Count of deaths
- Active: count of active case
- Last Update Time: Time and date of last report update.
- Migrated Others: Cases migrated to others.
- State Code: State code for reference.
- Other Value: Other non-mandate inputs
Note: Its dynamic data; hence should be consumed via AP for updated inputs.
Steps to create the dashboard:
Step1: Import the NumPy and Folium.
import pandas as pdimport foliumStep 2: Read CSV file containing state name with location (latitude, longitude):
State_With_Loc=pd.read_csv('https://drive.google.com/uc?id=11L8V4ywgRa186AiPxYNfx9Jipuwup8N_&export=download',index_col=0)Step 3: Read CSV file containing COVID 19 detailed data with state name:
State_With_Covid_Data =pd.read_csv('https://api.covid19india.org/csv/latest/state_wise.csv')Step 4: Remove useless data in COVID 19 data frame from the column.
State code,Delta_Confirmed,Delta_Recovered,Delta_Deaths,etc
State_With_Covid_Data=State_With_Covid_Data.iloc[:,:6]Step 5: Merge and store the useful data in variables so that we can access them easily.
Location_Data={}for name,lat,log in zip(State_With_Loc['State.Name'],State_With_Loc['latitude'],State_With_Loc['longitude']): Location_Data[name]=(float(lat),float(log))Step 6: Create a folium object for map
Map=folium. Map ()Step 7: Iter through all the rows of COVID data and show them on a map based on latitude and longitude.

- Loop through the in-scope merged data set.
- Based on state data read each respective label value for map visualization.
- Capture the label for Map representation.
- Add the label marker to the map.
References:
https://towardsdatascience.com/an-introduction-to-pandas-in-python-b06d2dd51aba
https://python-visualization.github.io/folium/
https://blog.dominodatalab.com/creating-interactive-crime-maps-with-folium/
https://drive.google.com/uc?id=11L8V4ywgRa186AiPxYNfx9Jipuwup8N_&export=download
Original Link: https://dev.to/bhuvneshsain/covid-19-dashboard-in-7-easy-steps-3flc
Dev To
More About this Source Visit Dev To