
Some of Our Sources
View All SourcesHelp Webnuz
Referal links:
YEStifications: Exploring how users engage with notification prompts in the Chrome UX Report
example.com wants to show notifications
Notifications can be an effective way to keep users engaged, but many websites are unable to get users past the permission prompt. A common problem is prompting out of context, as soon as the page loads or without an explanation of how they will be used. So how do users tend to engage with these permission prompts? CrUX to the rescue.
The Chrome UX Report (CrUX) now includes data from 30,000 websites on users' engagement with notification prompts. The data is made available in a public BigQuery repository, which we'll explore in this post to see how users engage with prompts across the web. Let's dive in!
The state of notification permissions
For starters, let's get a feel for the number of websites we're working with in this dataset.
SELECT COUNT(DISTINCT origin)FROM `chrome-ux-report.all.202001`WHERE experimental.permission.notifications IS NOT NULLThe results show that there are 31,515 origins with permission data. An origin is the top-level address of a website, everything before the first "/" of the path, like https://www.example.com. User experience data from pages on the samewebsite are all rolled up at the origin level.
Now let's look at the permission data for a single website, for example Slack.
SELECT SUM(experimental.permission.notifications.accept) AS accept, SUM(experimental.permission.notifications.dismiss) AS dismiss, SUM(experimental.permission.notifications.deny) AS deny, SUM(experimental.permission.notifications.ignore) AS `ignore`FROM `chrome-ux-report.all.202001`WHERE origin = 'https://app.slack.com'| Accept | Dismiss | Deny | Ignore |
|---|---|---|---|
| 92.10% | 5.67% | 1.96% | 0.28% |
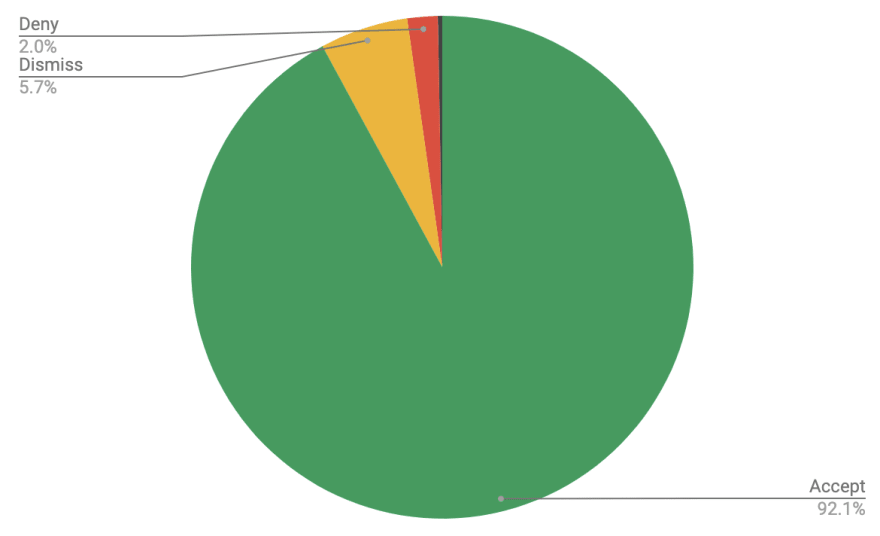
As you can see, the Slack app has a very good permission acceptance rate for their notification prompts at 92%. In other words, 92% of users who get the prompt end up granting Slack permission to show them notifications. About 6% of users close the prompt without explicitly deciding one way or the other, 2% of users explicitly disallow Slack from showing them notifications, and ~0% of users leave the prompt entirely untouched.
But how representative is Slack of the experience across the web? Let's zoom out and see how all 30,000 websites stack up.
SELECT origin, SUM(experimental.permission.notifications.accept) AS accept, SUM(experimental.permission.notifications.dismiss) AS dismiss, SUM(experimental.permission.notifications.deny) AS deny, SUM(experimental.permission.notifications.ignore) AS `ignore`FROM `chrome-ux-report.all.202001`WHERE experimental.permission.notifications IS NOT NULLGROUP BY originORDER BY `ignore` ASC, accept DESC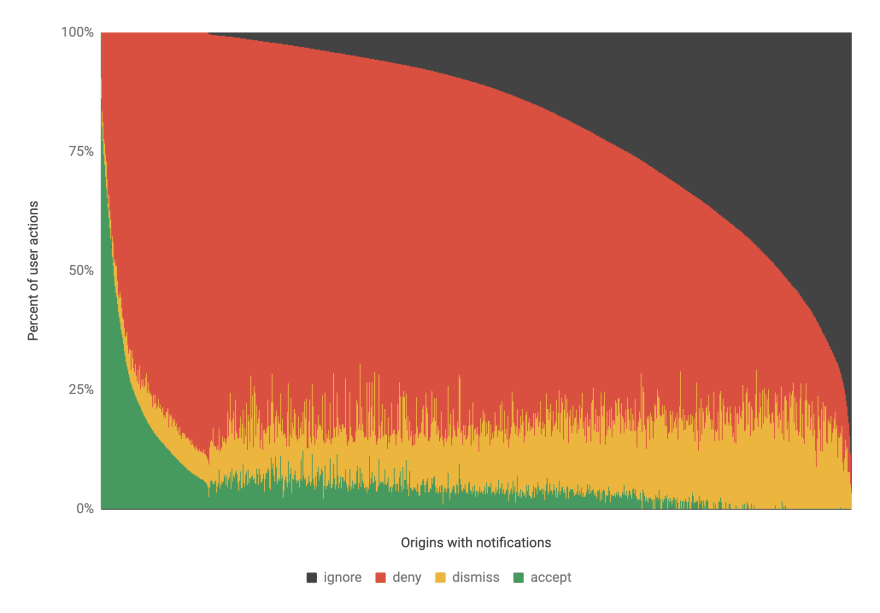
What are we looking at here? The curved gray area on the top right of the chart shows the distribution of ignores across all websites with permission data. Next, the red area taking up the most space in the middle of the chart represents the proportion of user engagements that reject the permission prompt. The green area that curves down from the left edge of the chart represents the proportion of user engagements that accept the prompt. And the remaining yellow area between accept and deny is the dismissal rate.
We can draw a couple of insights from this visualization:
Most glaringly, there's a lot of red and not a lot of green in this chart. Users are highly likely to be denying notification permission prompts rather than accepting them. Slack is an extreme example of an outlier website with a high acceptance rate.
There seems to be an inverse correlation between deny and ignore rates. As sites have smaller deny rates, their ignore rates increase. We could interpret the lack of prompt interaction as an implicit rejection of permission.
So if Slack is such an outlier, what does a typical website look like?
SELECT AVG(accept / total) AS accept, AVG(dismiss / total) AS dismiss, AVG(deny / total) AS deny, AVG(`ignore` / total) AS `ignore`FROM ( SELECT SUM(experimental.permission.notifications.accept) AS accept, SUM(experimental.permission.notifications.deny) AS deny, SUM(experimental.permission.notifications.ignore) AS `ignore`, SUM(experimental.permission.notifications.dismiss) AS dismiss, SUM(experimental.permission.notifications.accept + experimental.permission.notifications.deny + experimental.permission.notifications.ignore + experimental.permission.notifications.dismiss) AS total FROM `chrome-ux-report.all.202001` WHERE experimental.permission.notifications IS NOT NULL)| Accept | Dismiss | Deny | Ignore |
|---|---|---|---|
| 16.71% | 23.84% | 40.74% | 18.71% |
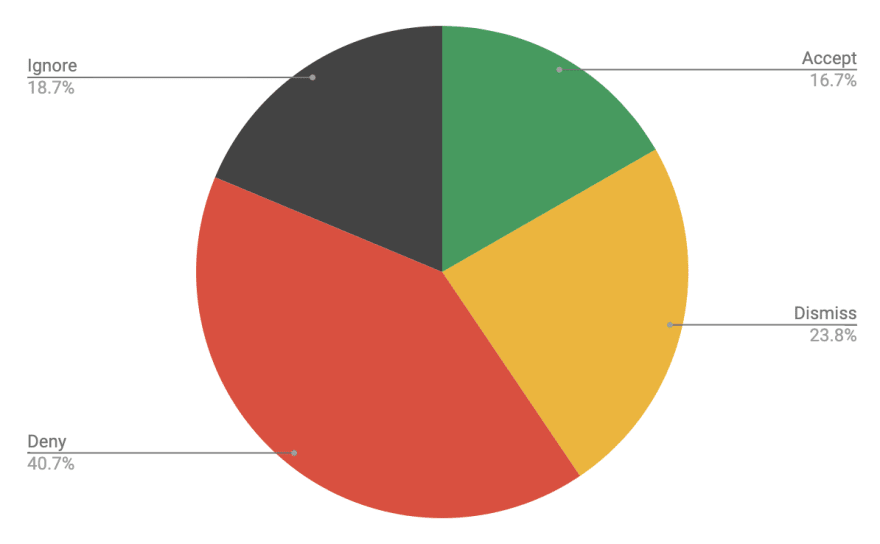
This is a more realistic view of the state of notification permissions. Keep in mind that we're averaging the UX for many websites together, even if they have drastically different numbers of users. So this is showing us that the average website has a notification prompt acceptance rate of 17%, 24% dismissal, 41% rejection, and 19% ignore.
What else can we learn about user behavior from this dataset? We could also slice this average distribution by users' device form factor.
SELECT device, AVG(accept / total) AS accept, AVG(dismiss / total) AS dismiss, AVG(deny / total) AS deny, AVG(`ignore` / total) AS `ignore`FROM ( SELECT form_factor.name AS device, SUM(experimental.permission.notifications.accept) AS accept, SUM(experimental.permission.notifications.deny) AS deny, SUM(experimental.permission.notifications.ignore) AS `ignore`, SUM(experimental.permission.notifications.dismiss) AS dismiss, SUM(experimental.permission.notifications.accept + experimental.permission.notifications.deny + experimental.permission.notifications.ignore + experimental.permission.notifications.dismiss) AS total FROM `chrome-ux-report.all.202001` WHERE experimental.permission.notifications IS NOT NULL GROUP BY device)GROUP BY deviceORDER BY accept DESC| Device | Accept | Dismiss | Deny | Ignore |
|---|---|---|---|---|
| phone | 22.76% | 18.03% | 57.33% | 1.88% |
| tablet | 18.75% | 20.24% | 58.34% | 2.67% |
| desktop | 6.11% | 34.01% | 11.61% | 48.27% |
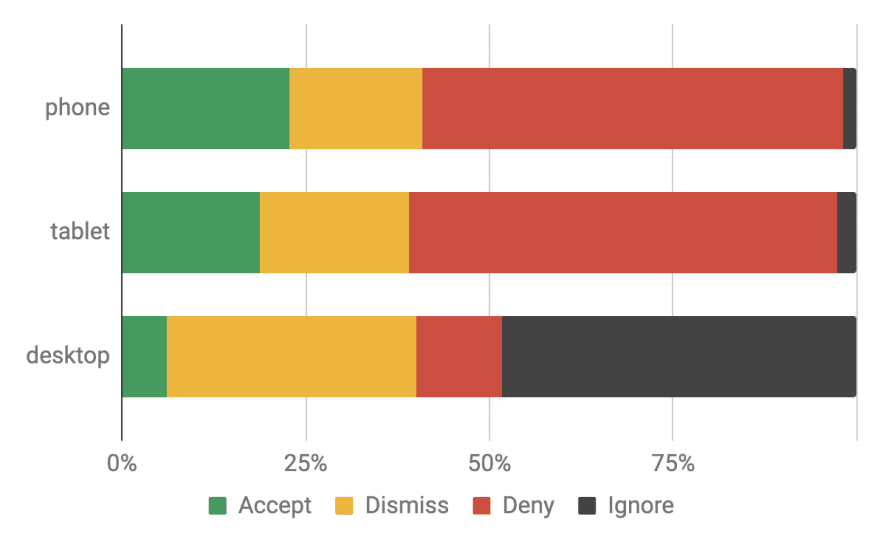
Ok this is significant. There is a huge difference in engagement between phones and desktops. Phone users are very unlikely to ignore the prompt, whereas desktop users ignore the prompt about half the time on average. The simplest explanation is screen size; it's a lot harder to ignore a prompt when it's taking up a larger portion of your screen. Interestingly, despite the 57% rejection rate, phone users are the most likely to accept permission prompts, at 23%, compared to just 6% on desktop. One explanation may be that a phone is a much more natural and convenient form factor on which to receive notifications because it goes where you go.
Where we go from here
Users have been feeling the frustration of intrusive notification prompts and developers have only anecdotally heard about and experienced this frustration. Now we have actionable data to shed light on the quality of experience across the web. And it's clear from the CrUX data that relatively few websites are effectively enrolling users in notifications.
The Chrome team has announced that it is rolling out changes to how prompts are shown to users to minimize frustration, saying "sites with very low acceptance rates will be automatically enrolled in quieter prompts". So it's especially important for site owners to be aware of their prompt performance.
If your site requests permission to show notifications, add instrumentation so you can monitor the response rates. The CrUX dataset is not a substitute for your own UX monitoring, but it can be helpful for filling in gaps, seeing how similar websites are performing, and tracking the trends across the web. Read up on best practices for requesting permission to improve your response rates and get more yestifications than notifications.
The queries shown in this post can be run on BigQuery. You're strongly encouraged to remix the queries to discover your own insights. Read more about using CrUX on BigQuery to get started. If you have any questions or feedback about the data, the CrUX team would love to hear from you on any of these channels:
- chrome-ux-report on Google Groups
- @ChromeUXReport on Twitter
- questions tagged with chrome-ux-report on StackOverflow
- GoogleChrome/CrUX on GitHub
Original Link: https://dev.to/chromiumdev/yestifications-exploring-how-users-engage-with-notification-prompts-in-the-chrome-ux-report-4h7c
Dev To
More About this Source Visit Dev To