An Interest In:
Web News this Week
- April 15, 2024
- April 14, 2024
- April 13, 2024
- April 12, 2024
- April 11, 2024
- April 10, 2024
- April 9, 2024
Stop Console.Logging! This is How to Use Chrome to Debug JavaScript
If you console.log() when you debug, youre doing it wrong. Theres an easier way and its right in the palm of your browser.
Sound familiar?
Javascript is the most popular programming language according to StackOverflows 2019 survey. If you develop with Javascript, youve most likely came across a situation where you had to fix a bug or two.
No problem! you say to your rubber ducky, lets reproduce the bug and fix it with console.log(). Now, what if I told you that this is not the best practice?
At the end of this article, I included a TL;DR summary.
Console logging works, but theres a better way.
Instead of console.logging and restarting every time you want to debug, you can instead use Chrome DevTools (right click + inspect).
Perhaps youre already using it to view and modify HTML/CSS elements, monitor console logs, and measure network performance. But did you know that Chrome has a powerful built in debugging feature where you can:
- view source code
- set breakpoints
- step into, step over, and step out
The rest of the article is a step by step guide on how to use Chromes debugging feature with Angularbut feel free to follow along with your existing projects on any javascript frontend framework.
Setting up your environment.
NOTE: If you already have an existing project, skip to the next section.
In this section, we will quickly set up an Angular app using their official guide.
Prerequisites
Node.js version 10.9.0 or later.
Step 1. Install Angular CLInpm install -g @angular/cli
Step 2: Create a workspace and initial applicationng new my-app
Step 3: Run the applicationcd my-app
ng serve --open
This will open your browser to the url localhost:4200 Angular v8.2
Create the bug
For the purposes of this demonstration, lets create a bug and then debug it ;).
Open your favorite text editor and navigate to src/app/app.component.ts
Replace the lines with the following and save.
Look at the browser again and you should see a bug!
[object Object] is simply the default return value when converting a POJO (plain old javascript object) to a string. This is not a desired outcome so lets fix it!
Debug Mode
1. Inspect the sources
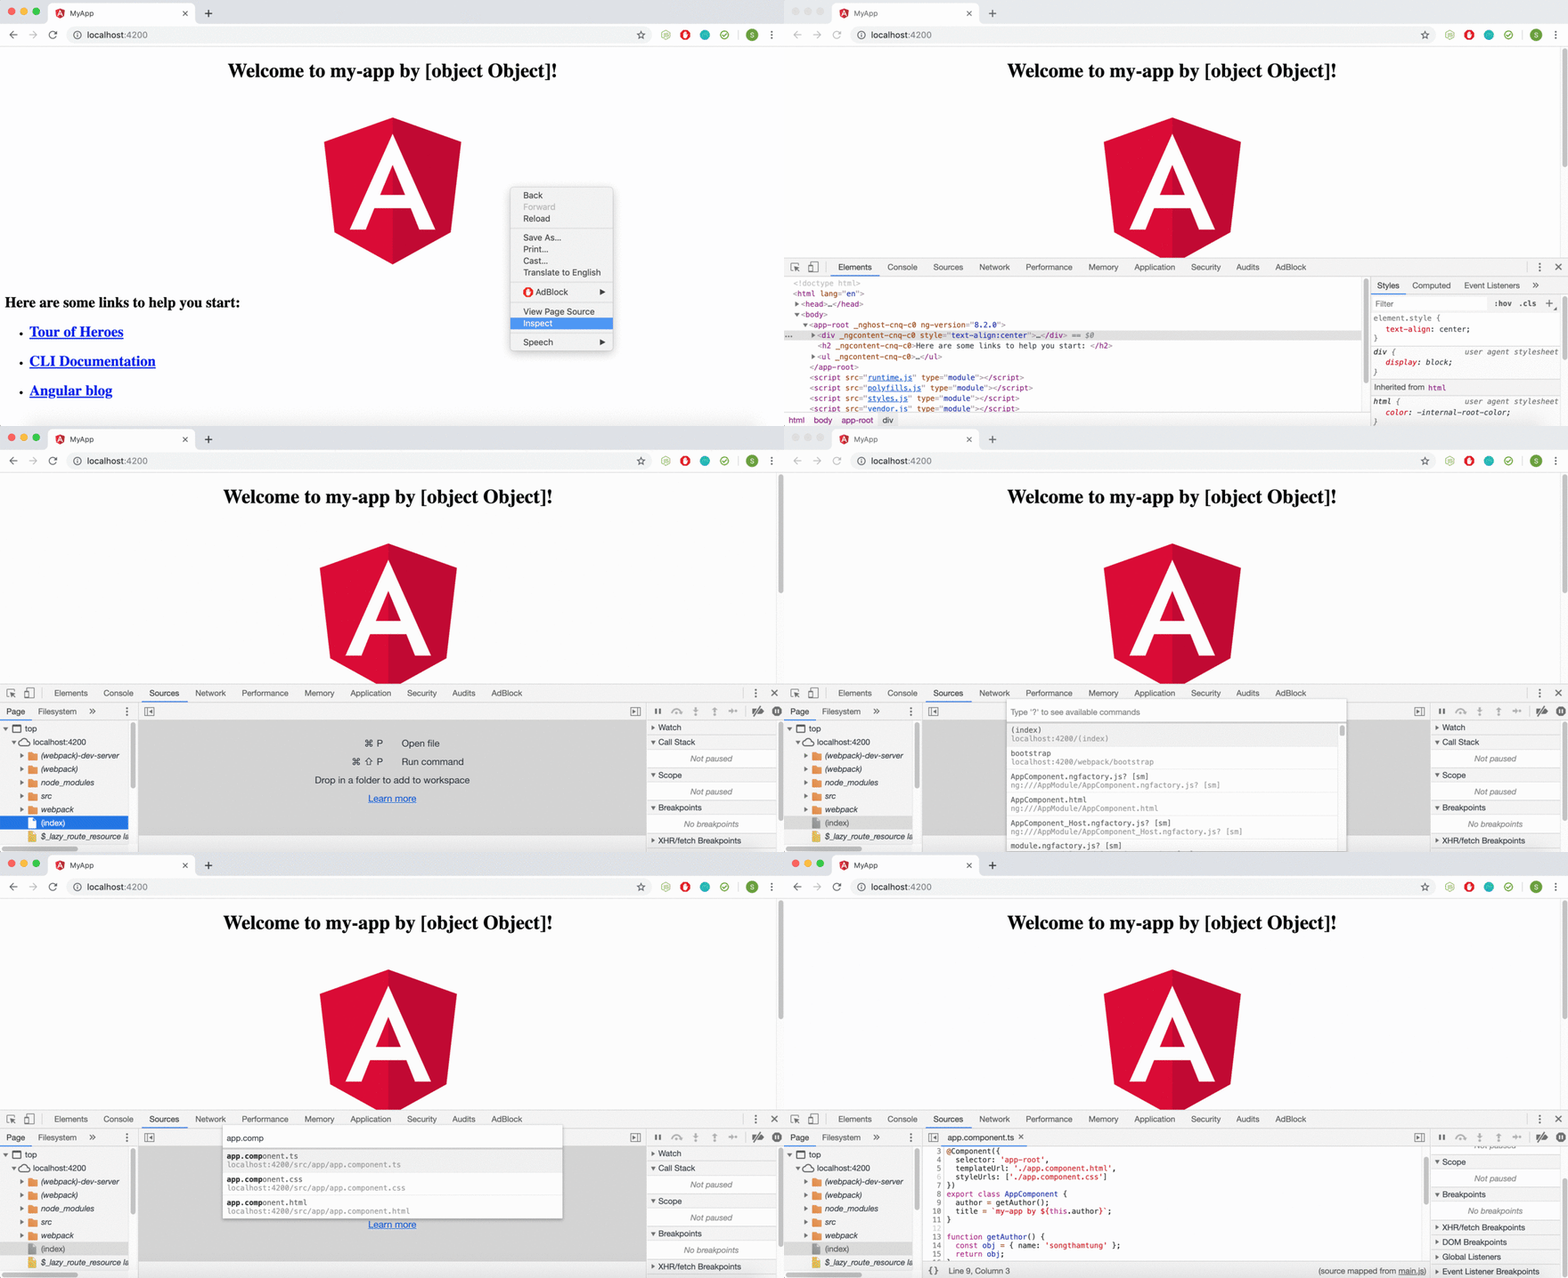
Using Chrome, right click > inspect > sources > cmd + p > search file
If done correctly, this will take you to the source code, where the bug lurks.
2. Set breakpoints
Setting breakpoints is vital to debugging effectively. A breakpoint is an intentional pause in a program, which allows the developer to inspect the internal state of the application at that moment. You can use it to view variables and perform other debugging functions.
A breakpoint is an intentional pause in a program, which allows the developer to inspect the internal state of the application at that moment.
To set a breakpoint, click the line number where you want the program to pause. In the example below, we set it at line 9.
Refresh the browser and you should see Paused in debugger.
Hover your mouse over the variable author it should be undefined. The reason that its undefined is because the program hasnt reached this line yet. It finished executing line 8 and is about to reach line 9.
Press to continue execution.
3. Step into, step over, and step out.
These basic 3 steps is the bread and butter for debugging.
- Step into is when the debugger steps into or inside a function
- Step over is when the debugger steps to the next line
- Step out is when the debugger steps outside the current function
Refresh the browser again and once the debugger pauses at your breakpoint, step into the function using the panel on the right hand side. This will take you to the function getAuthor(). Hover your mouse over obj and you will see undefined since we havent actually executed it yet. Step over to execute the line and hover your mouse over obj again. This time, you should see a POJO. Step out to return to the caller and now this time author is no longer undefined.
Great so we now know that author object has value. How do we fix it?
4. Fix the bug
Replace line 10 with the following and save.title =my-app by ${this.author.name};
5. Deactivate breakpoints

Click Deactivate breakpoints. It changes blue to indicate that its active. While this is set, DevTools ignores any breakpoints youve set.
Refresh the page.
Fixed!
Closing
Congratulations! You now know how to use Chrome DevTools to debug efficiently. While console.log() does have a place in programming, its limited to modifying the source code, restarting the program, and nonstop execution. Chromes built in debugging tool addresses these disadvantages and offers you the ability to stop, inspect, and investigate whats happening in the program at the specific point in time.
TL;DR
Open inspector, click the Sources tab, and CMD + P to view your source code and set breakpoints.
For more information, check out Googles blog on this topic.
Thanks for reading! Originally published on Faun.
Original Link: https://dev.to/songthamtung/stop-console-logging-this-is-how-to-use-chrome-to-debug-javascript-48nm
Dev To
 An online community for sharing and discovering great ideas, having debates, and making friends
More About this Source Visit Dev To


