
An Interest In:
Web News this Week
- March 27, 2024
- March 26, 2024
- March 25, 2024
- March 24, 2024
- March 23, 2024
- March 22, 2024
- March 21, 2024
Some of Our Sources
- Pearsonified
- Spoon Graphics
- TutsPlus - Design
- Creative Curio
- Fuel Your Creativity
- Web Designer Depot
- FanExtra - PSD
- Design Modo
- Web Resource Source
- Daily Now
Help Webnuz
Referal links:
Crash Reporting With Crashlytics
In Android, there is a high probability of your app crashing even after you have manually and automatically tested it. This can be due to factors such as incompatibility with different API levels, screen sizes, phone memory, hardware sensor availability, and vendors' customization to suit their individual devices. Crashlytics will help you diagnose these problems.
Crashes make your users sad and angry. They might even want to uninstall the app if this happens often. Then give your app a bad review, give negative feedback on the play store, and then go install your competitor's app! In this already crowded and competitive app market, making your users happy is vital for your app success.
It's quite impossible for your app not to have crashes, but keeping your crashes down to a minimum is very important. During development and testing, you might not have encountered a particular crash, but in production when your users are actively using it, you'll begin to see crashes. Using a robust and powerful crash reporting solution is essential to collect information about your app crashes and to give you an insight into how you can fix the problem to keep your users happy.
In this tutorial, I'll show you how to use Crashlytics, a free and powerful yet lightweight crash reporting solution, which is part of the Fabric set of developer tools by Twitter. We'll create a simple app that crashes when a button is clicked, so that we can get insight into the crash with Crashlytics.
1. Why Use Crashlytics?
Here are a few reasons you might want to use it:
- Easy to set up
- Unlimited apps, users, and crashes
- Real-time alerts
- Real-time crash reporting
- In-depth crash analysis
- Tracking of exceptions
- Easy to share crash report
- Beta app distribution
- A free mobile app to monitor your app on the go and get real-time alerts for critical issues
- Free!
2. Create an Android Studio Project
First, fire up Android Studio and create a new project ''CrashlyticsTutorial" with an empty activity called MainActivity.

3. Installing Fabric Plugin
You must first have an account at Fabric to integrate Crashlytics into your app. So fill in the required details and a confirmation email will be sent to you.

You can either choose to integrate Fabric with your project either by downloading the Android Studio plugin, which will automatically modify the files needed for the integration, or by manually modifying your build.gradle file. For this tutorial, we'll use the easiest way, which is with the plugin.
After clicking the confirmation link, you will be guided to install the plugin:
Step 1
Select Android as the platform.

Step 2
For Mac users: select Preferences… from the Android Studio / IntelliJ menu. Windows and Linux users: select Settings from the File menu.

Step 3
Select Plugins, click the Browse Repositories button, and search for "Fabric for Android".

Step 4
Click the Install plugin button to download and install the plugin.


4. Integrating Crashlytics
Step 1
To begin the integration of Crashlytics into your Android Studio project, enter your credentials to sign in.

Step 2
Select the Android project CrashlyticsTutorial and click the Next button.

Step 3
Fabric will list all the organizations you registered, so select the organization you want to associate the app with and click the Next button.

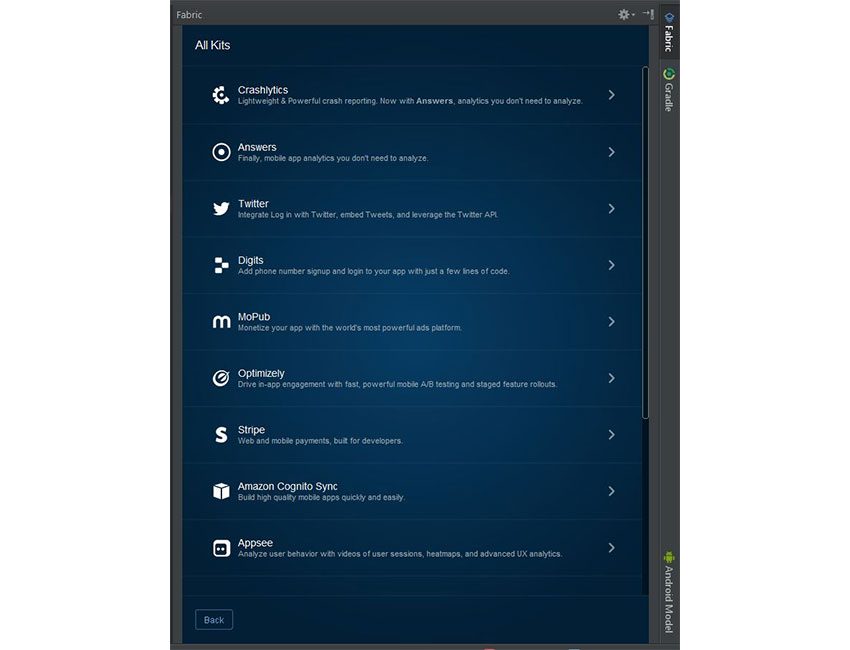
Step 4
Fabric will then list all of its kits. Since this is a Crashlytics tutorial, select Crashlytics and click the Next button.
Step 5
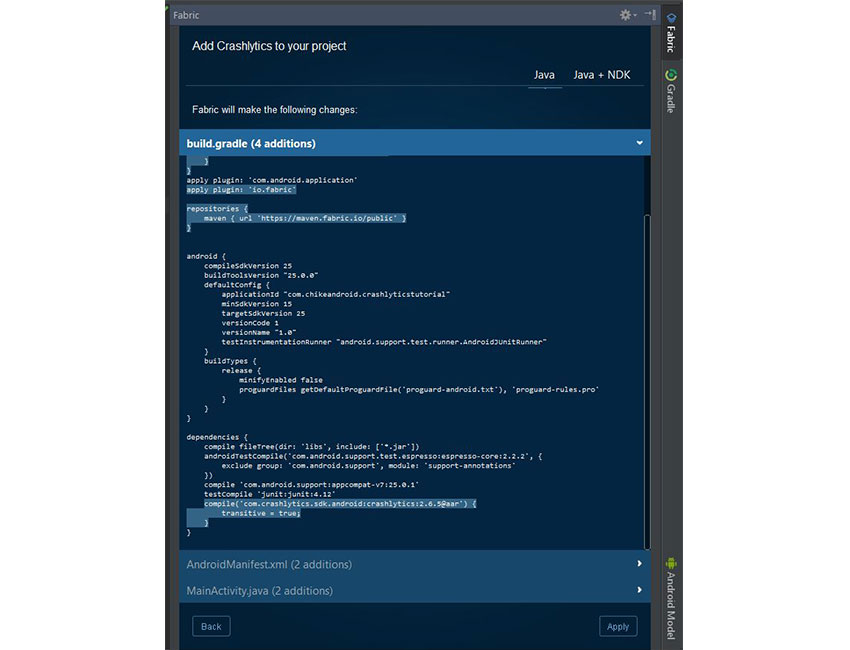
Click the Install button.

Fabric wants to make changes to your build.gradle, MainActivity.java and AndroidManifest.xml files, so click the Apply button for the changes to happen.
Step 6
Build and run your application so that we can make sure that everything is configured properly. If your app was successfully configured, you will get an email sent instantly to the email address you used to sign up with Fabric.

5. Viewing the Dashboard
Now that Crashlytics has been integrated successfully with our project, visit the main dashboard to see our app: CrashlyticsTutorial.

Clicking on a project will open the Crashlytics dashboard, which will list the issues encountered. So far we have none; later on, we'll revisit this dashboard when we have deliberately created a crash.

Inside the project Crashlytics dashboard, you get a general overview of crashes. You can filter crashes by app versions, events, days, status (open, closed or all), device, OS, or user activity (though the Answers kit needs to be enabled to use this feature). You can also see the total number of crashes, non-fatals, users affected, and more.
The Answers kit gives you real-time statistics on how your app is being used, including active user numbers, session length, stability rating, and retention.
6. Deliberately Creating a Crash
Understanding the Difference Between Crashes and Issues
The difference between crashes and issues is that Crashlytics combines similar crashes into issues (particular lines of code that appear to be triggering the same type of crash). For example, if you had 100,000 crashes reported, these may be attributable to just 60 issues.
Let's deliberately create a crash and view the logged issue on the dashboard.
Create a Layout
Here's the MainActivity layout file:
<?xml version="1.0" encoding="utf-8"?>
<RelativeLayout
    xmlns:android="https://schemas.android.com/apk/res/android"
    xmlns:tools="https://schemas.android.com/tools"
    android:id="@+id/activity_main"
    android:layout_width="match_parent"
    android:layout_height="match_parent"
    android:paddingLeft="@dimen/activity_horizontal_margin"
    android:paddingRight="@dimen/activity_horizontal_margin"
    android:paddingTop="@dimen/activity_vertical_margin"
    android:paddingBottom="@dimen/activity_vertical_margin"
    tools:context="com.chikeandroid.crashlyticstutorial.MainActivity">

    <Button
            android:id="@+id/btn_crash_now"
            android:layout_height="wrap_content"
            android:layout_width="wrap_content"
            android:text="Crash Now!"
            android:layout_centerVertical="true"
            android:layout_centerHorizontal="true" />

</RelativeLayout>
The crashNow() Method
Modify the MainActivity class to fire up the crashNow() method, which will trigger a RuntimeException when the button is clicked.
package com.chikeandroid.crashlyticstutorial;

import android.os.Bundle;
import android.support.v7.app.AppCompatActivity;
import android.view.View;
import android.widget.Button;

import com.crashlytics.android.Crashlytics;

import io.fabric.sdk.android.Fabric;

public class MainActivity extends AppCompatActivity {

    private Button mCrashNowButton;
    @Override
    protected void onCreate(Bundle savedInstanceState) {
        super.onCreate(savedInstanceState);
        Fabric.with(this, new Crashlytics());
        setContentView(R.layout.activity_main);

        mCrashNowButton = (Button) findViewById(R.id.btn_crash_now);

        mCrashNowButton.setOnClickListener(new View.OnClickListener() {
            @Override
            public void onClick(View view) {
                crashNow();
            }
        });
    }

    private void crashNow() {
        throw new RuntimeException("This is a crash");
    }
}
Crash!
Run the app and click the crash now button.

7. Revisiting the Dashboard
After the successful crash, revisit the dashboard to see the issue that was logged instantly. You will also get an email notification from Fabric about the crash. In the dashboard so far, we now have one issue, one crash, and one affected user. You can search for a specific issue with either the file name, method name, line number, or issue notes (single-term only).

When you click on an issue, it opens a page where you get an in-depth report on the crash. The page aggregates all the crashes that occurred.

The key parts of this UI are as follows:
1 | The project and package name, including the line number where the crash occurred |
2 | Recent crashes filter |
3 | The total number of crashes |
4 | The total number of users affected by the crash |
5 | Toggle for marking the issue closed or open |
6 | Chart of the number of crashes per day |
7 | Button to share the issue via Twitter or with your team members |
8 | The percentage of crashed devices with proximity activated |
9 | The percentage of crashes that happened when the app was in focus |
10 | The percentage of crashed devices that were rooted |
11 | Breakdown of the model names of crashed devices |
12 | Breakdown of the OS of crashed devices |
13 | Download the exception stack trace as a .txt file |
14 | An expandable view for the stack trace |
15 | View details of each individual crash report. |
On this page, you can also view notes and write notes about each crash.
8. Other Crashlytics Features
Fabric Mobile App
Fabric also has a free mobile app available on the Google Play Store. With the mobile app, you get an instant push notification whenever a critical crash occurs, as well as some data giving insight into the issue: a breakdown of devices and platforms affected, the full stack trace, the number of affected users, who is affected, notes entered about an issue, and an option to share the issue with team members. All this data is updated in real time.

Log Caught Exceptions
Crashlytics also enables you to log exceptions caught in a catch block using Crashlytics.logException(Exception).
try {
  myMethodThatThrows();
} catch (Exception e) {
  Crashlytics.logException(e);
  // handle your exception here!
}
All logged exceptions will appear as “non-fatal” issues in the Fabric dashboard. Crashlytics processes exceptions on a dedicated background thread, so logging an exception won't block the app's UI and performance impact to your app will be small.
Custom Logging
When you log an exception, you can create a custom log message associated with your crash data, and it will be displayed on Crashlytics dashboard on that particular crash.
Crashlytics.log(int priority, String tag, String msg);
In addition to appearing in your report, it will also be added to Android's LogCat. To prevent that from happening, instead use:
Crashlytics.log(String message);
As in the example below:
private void crashNow() {
    Crashlytics.log("My log message");
    throw new RuntimeException("This is a crash");
}
Uniquely Identify Users
To uniquely identify the end user of your application in the dashboard for easy debugging, Crashlytics has the methods below:
Crashlytics.setUserIdentifier("12345");
Crashlytics.setUserEmail("[email protected]");
Crashlytics.setUserName("Test User");
Use Crashlytics.setUserIdentifier to provide an ID number, token, or hashed value that uniquely identifies the end user of your application without disclosing or transmitting any of their personal information.
Beta Distribution
If you want to beta distribute your app to a set of users for testing and get feedback before finally releasing your app to the public, Crashlytics has a very useful free tool called Beta. I won't go into it here, but check out the official docs for more information.
Disable Crashlytics for Debug Builds
You can disable Crashlytics for debug builds, which will speed up your debug build process.
First, add this to your build.gradle file:
buildTypes {
    ...
    debug {
        // Disable fabric build ID generation for debug builds
        ext.enableCrashlytics = false
    }
}
Then, disable the Crashlytics Kit at runtime.
...
@Override
protected void onCreate(Bundle savedInstanceState) {
    super.onCreate(savedInstanceState);

    // Set up Crashlytics, disabled for debug builds
    Crashlytics crashlyticsKit = new Crashlytics.Builder()
    .core(new CrashlyticsCore.Builder().disabled(BuildConfig.DEBUG).build())
    .build();

    Fabric.with(this, crashlyticsKit);
    setContentView(R.layout.activity_main);

}
Conclusion
Crashlytics is very powerful and useful for effective crash reporting. In this tutorial, you learned:
- how to integrate Crashlytics into your Android project
- how the Crashlytics dashboard can give you insight into an issue
- how to log caught exceptions
- how to write custom logs
- how to uniquely identify your users for easy debugging
- how to disable Crashlytics for debug-builds
To learn more about Crashlytics, you can refer to its official documentation. You can also check out some of our other tutorials on cloud-based services for Android development.
 Android SDKGet Started With Firebase for Android
 Android SDKGoogle Play Games Services: Creating Events and Quests
 QuizQuiz: Amazon Web Services, Do You Know the Right Tool for the Job?
 Android SDKHow to Create an Android Chat App Using Firebase
Original Link:
TutsPlus - Code
 Tuts+ is a site aimed at web developers and designers offering tutorials and articles on technologies, skills and techniques to improve how you design and build websites.
More About this Source Visit TutsPlus - Code